
Why Traders Use Monte Carlo Simulation
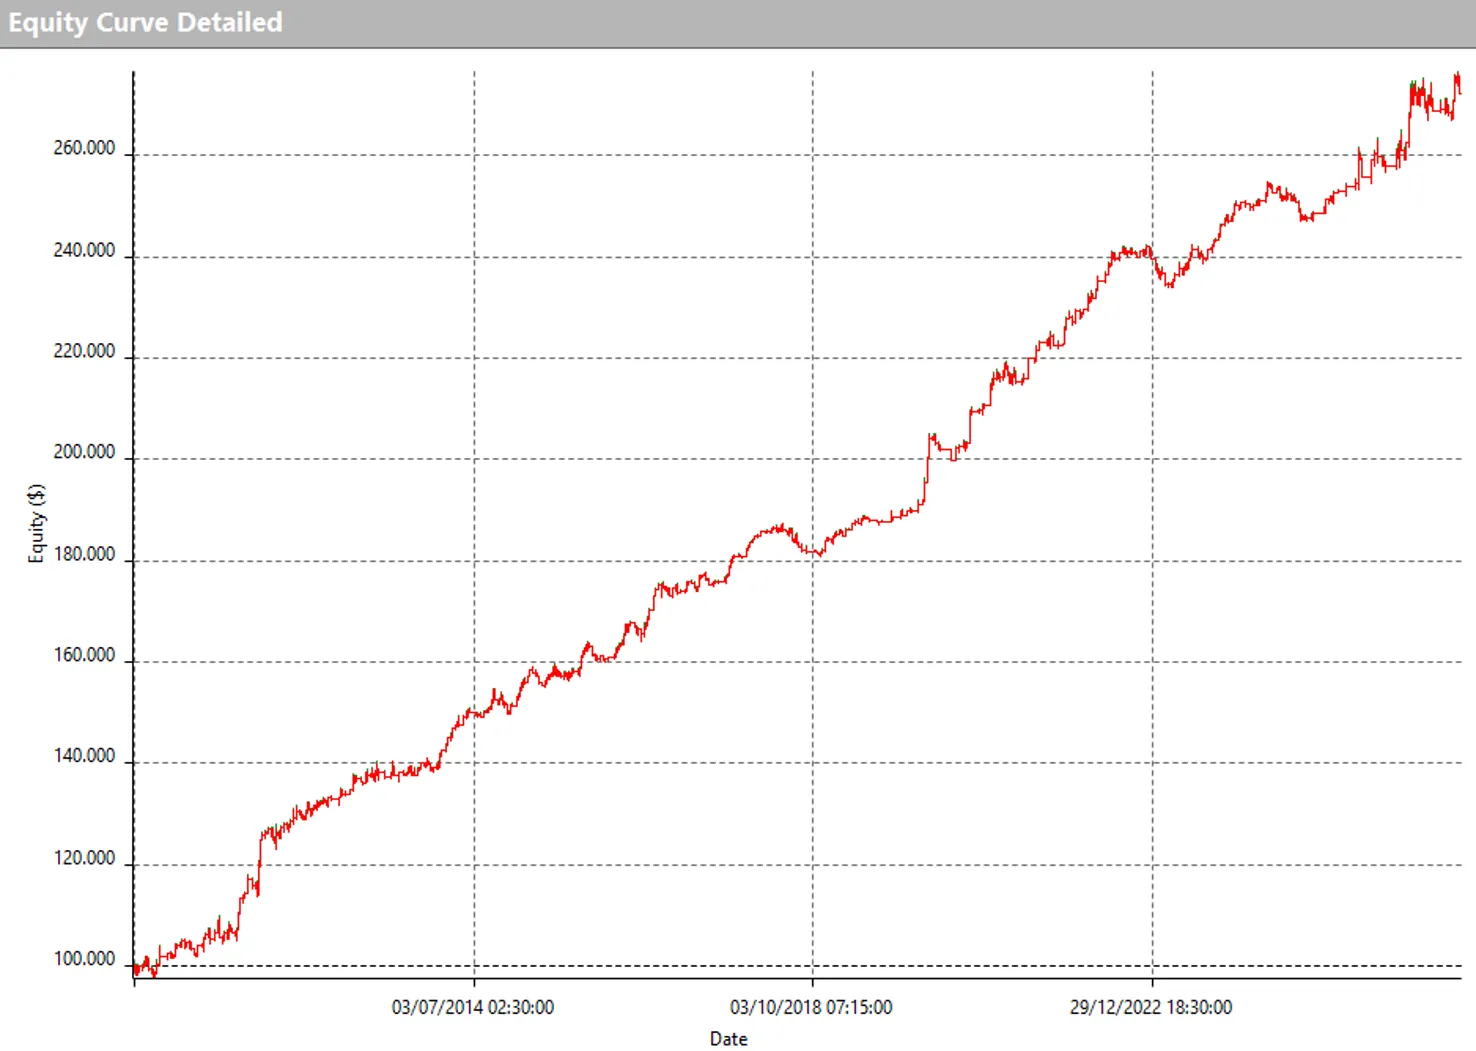
A profitable backtest is an encouraging first sign, but it does not guarantee how a trading system will perform in the future. It simply shows what would have happened if a specific set of rules had been applied to a particular sequence of historical data.
That is precisely the issue: the sequence shown in the backtest is only one of many possible sequences. Winning and losing trades could have occurred in a different order, producing a different equity curve and, more importantly, a different drawdown.
Monte Carlo simulation helps traders explore this issue in greater depth. It cannot predict the future, but it can generate a range of alternative scenarios based on the available results. For anyone developing trading systems with a systematic approach, it can therefore be a valuable tool for assessing risk beyond the limits of a single backtest.
What Is Monte Carlo Simulation in Trading?
In systematic trading, Monte Carlo simulation can be used to generate numerous variations of the trade sequence produced by a backtest.
Suppose, for example, that we have a track record of 200 trades. Software can repeatedly rearrange the order of those trades and recalculate the equity curve for each sequence. Instead of analyzing a single curve, we can then examine hundreds or thousands of possible equity paths.
There are several ways to run a Monte Carlo simulation. Some of the most common include:
- reshuffling trades, which changes their order while keeping the original set of trades intact;
- resampling with replacement, which allows some trades to appear more than once while others may not be selected at all;
- varying specific assumptions, such as trading costs, slippage, or execution parameters, when supported by the software.
These methods do not answer exactly the same question. Before interpreting the results, it is important to understand how the simulation was constructed.
Sequence Risk: What a Backtest Can Hide
When trades are reshuffled without changing their individual results, the overall return remains the same. What changes is the path taken to get there.
A series of losses spread out over time may produce a relatively modest drawdown. Those same losses occurring back-to-back, however, could create a much deeper and more difficult losing period.
This phenomenon is often called sequence risk. Monte Carlo simulation can help estimate how much the risk profile shown by a backtest depends on the specific order in which the trades occurred.
A system with a seemingly smooth equity curve may therefore show larger drawdowns in some simulated scenarios than it did in the historical backtest. This does not necessarily mean the system should be rejected. It does suggest, however, that its risk may be greater than the original equity curve indicates.
Monte Carlo Simulation and Overfitting Are Not the Same Thing
Monte Carlo simulation is useful, but it does not test every aspect of a trading system’s robustness.
In particular, it is not enough to detect overfitting, which occurs when a strategy’s rules are tailored too closely to historical data and fail to perform similarly on new, unseen data.
For this reason, Monte Carlo simulation should be part of a broader validation process that also includes tools such as:
- out-of-sample testing;
- parameter stability testing;
- analysis across different markets and time periods, when consistent with the system’s underlying logic;
- a realistic assessment of trading costs and execution conditions;
- walk-forward analysis.
This reflects the same principle behind the systematic approach followed at Unger Academy: historical results should not be viewed in isolation. Instead, they should be evaluated through multiple tests designed to provide a clearer understanding of a strategy’s strengths and limitations.
What Results Should You Examine in a Monte Carlo Simulation?
Focusing only on the average equity curve can obscure some of the simulation’s most useful information. The main value lies in the distribution of possible outcomes, including the less favorable scenarios.
Metrics worth examining may include:
- the distribution of maximum drawdown;
- the duration of recovery periods;
- the probability of exceeding a specified loss threshold;
- the variability of the final outcome, when the resampling method can alter it;
- the frequency and length of consecutive losing streaks.
Specific percentiles within the distribution can also be useful. For example, a high drawdown percentile may help traders examine unfavorable scenarios rather than relying solely on the average. However, the percentile and thresholds selected should depend on the purpose of the analysis, the characteristics of the system, and the trader’s risk tolerance. There is no single value that works for every system.

How Many Trades Are Needed to Produce Meaningful Results?
The quality of a simulation also depends on the underlying data. If the historical sample contains only a small number of trades, every generated combination will still reflect that limited sample. Software may produce thousands of equity curves, but it does not automatically create new information beyond the original trades.
There is no universal threshold beyond which a simulation suddenly becomes reliable. A larger sample generally provides a more informative statistical foundation, but the number of trades should be considered alongside other factors, including:
- the system’s trading frequency;
- the range of market conditions represented in the historical data;
- the length of the testing period;
- whether performance is concentrated in a small number of unusually large winning or losing trades;
- how well the sample represents the type of strategy being tested.
A simulation based on a small number of trades may still provide some insight, but its results should be interpreted with greater caution. Numerical precision does not necessarily imply a reliable estimate.
What to Do If the Simulation Shows Deeper Drawdowns
If the simulated scenarios show drawdowns that are substantially larger than the one recorded in the original backtest, the result deserves closer examination. The appropriate response depends on the overall picture, not on a rigid rule.
Possible steps include:
- reviewing position sizing to determine whether the exposure is consistent with the risk identified;
- running additional robustness tests;
- collecting a larger sample of trades;
- comparing the system’s behavior across different market regimes;
- deciding not to trade the strategy if its risk remains incompatible with your criteria.
Position size can affect the monetary size of a drawdown, but it cannot fix a flaw in the system’s underlying logic. This is why money management should complement the strategy analysis, not replace it.
The Limitations of Monte Carlo Simulation
Even a highly sophisticated simulation remains dependent on the data and assumptions used to build it. It cannot account for events that never appeared in the sample, structural changes in the market, or trading conditions that were not included in the model.
Results can also vary significantly depending on the method selected. Reshuffling trades, resampling them, or changing costs and slippage means simulating different phenomena.
Monte Carlo simulation cannot certify that a trading system will work in the future. Its value lies in revealing scenarios that a single backtest cannot show and helping traders make more informed decisions about risk.
Conclusion
A backtest is an important step in developing a trading system, but it represents only one possible sequence of outcomes. Monte Carlo simulation broadens the analysis and helps reveal how drawdowns, losing streaks, and recovery times might change under different scenarios.
It is not a final verdict, nor does it replace other robustness tests. It is one tool within a broader process built on rules, data, and risk assessments that are consistent with the trader’s own risk profile.
This focus on the process, rather than on a single result, is what separates a systematic approach from a decision based solely on an attractive equity curve.
Frequently Asked Questions About Monte Carlo Simulation in Trading
What is Monte Carlo simulation in trading?
It is a statistical technique that generates numerous scenarios based on backtest results. Depending on the method used, it can reshuffle or resample trades to analyze variations in the equity path and risk profile.
What is Monte Carlo simulation used for in a trading system?
It is primarily used to examine sequence risk, the distribution of drawdowns, and other scenarios that do not appear in the single historical sequence shown by a backtest.
Does Monte Carlo simulation prove that a system is robust?
No. It can provide valuable additional information, but it should be combined with out-of-sample testing, walk-forward analysis, and other checks appropriate to the strategy.
How many trades are needed for a reliable simulation?
There is no number that applies to every trading system. In general, a larger and more representative sample provides more useful information. However, the number of trades should be evaluated alongside the length of the historical period, trading frequency, and the variety of market conditions included.
Can Monte Carlo simulation predict future drawdowns?
No. It can show a distribution of drawdowns consistent with the data and assumptions used, but it cannot predict with certainty what will happen in the future.