
Can a systematic trading strategy produce a positive result when only 36% of its trades are winners? And is a strategy with a win rate above 55% necessarily better?
To explore those questions, we’ll compare two automated trading strategies developed for Nasdaq futures. Both Nasdaq trading strategies aim to capture directional moves away from the session open, but they use different criteria to decide when to enter. Their historical results differ too: the first strategy has a 36.49% win rate and an average trade of $129.69; the second has a 55.62% win rate and an average trade of about $438.
We’ll look at how each strategy works, what governs its entries and exits, and what the results tell us about evaluating a trading system.
Both strategies have spent years outside the development sample and in live trading, with the first dating back to 2018. Even so, the results discussed here are historical and do not guarantee future performance.
#1 – Nasdaq Trading Strategy with Entries Based on Volatility and ATR
The first strategy trades Nasdaq futures on a 15-minute timeframe and was originally developed in 2018.
The idea is straightforward: look for days when the market has made a particularly strong move away from the session’s opening price.
To determine whether a move is large enough, the strategy uses the Average True Range (ATR), a commonly used measure of volatility. Instead of requiring a fixed distance from the open, it adjusts its entry threshold to the volatility of each period.
For long trades, the strategy looks for a strong upward move from the open, requiring an extension equal to six times the ATR. Additional filters help select specific market conditions.
The short side follows a similar idea but requires a larger move: the market must be at least 8.5 ATR below the open before a short entry is considered.
This difference between long and short trades is a key feature. The strategy does not apply identical rules to both sides of the market. It uses different conditions and filters to account for the distinct characteristics of upward and downward moves in Nasdaq futures.
Once a position is open, the strategy manages it with a stop-loss, take-profit target, and breakeven rule. Any position still open near the end of the session is closed before the session ends.
First Strategy Results: Why a Low Win Rate Does Not Tell the Whole Story
As Figure 1 shows, the strategy’s equity curve rises fairly steadily over the long term, although it goes through periods of slower growth and drawdowns. It maintains an upward trend across much of the historical record, generating approximately $150,000 in total profit.
Figure 2 helps explain that result. Of 1,173 trades, 428 were winners, 454 were losers, and 291 closed at breakeven. The win rate was therefore 36.49%, which may seem relatively low. The strategy offsets that low win rate with a favorable relationship between winning and losing trades: the average winner was approximately $896, compared with an average loss of about $510. The ratio of average win to average loss was 1.76.
The short side is also worth a closer look. Although it produced far fewer trades than the long side, it had a slightly higher average profit per trade and a ratio of average win to average loss of 2.2. Overall, the strategy’s historical result depends less on winning frequently than on making more on its average winner than it loses on its average loser.


#2 – Nasdaq Trading Strategy with Entries Based on the Previous Session’s Range
The second strategy builds on a similar idea: capture directional moves that are large enough relative to the session open. What changes is how it determines whether a move is significant.
While the first strategy uses the Average True Range (ATR), this one uses the previous session’s high and low. It takes that session’s range and uses it to establish two levels, one above and one below the new session’s opening price.
For long trades, the entry level is set at a distance from the open equal to 65% of the previous session’s range. For short trades, the distance is larger, at 120% of that range. This strategy, too, applies different thresholds to the long and short sides.
The underlying logic remains similar: rather than trying to anticipate a move, the strategy waits for Nasdaq futures to show directional strength before considering an entry. Additional filters then narrow down the market conditions in which it can trade.
Position management also differs from the first strategy. Along with a stop-loss, breakeven rule, and take-profit target, it uses a dynamic trailing stop toward the end of the session.
Second Strategy Results: More Winning Trades, but a Different Balance Between Gains and Losses
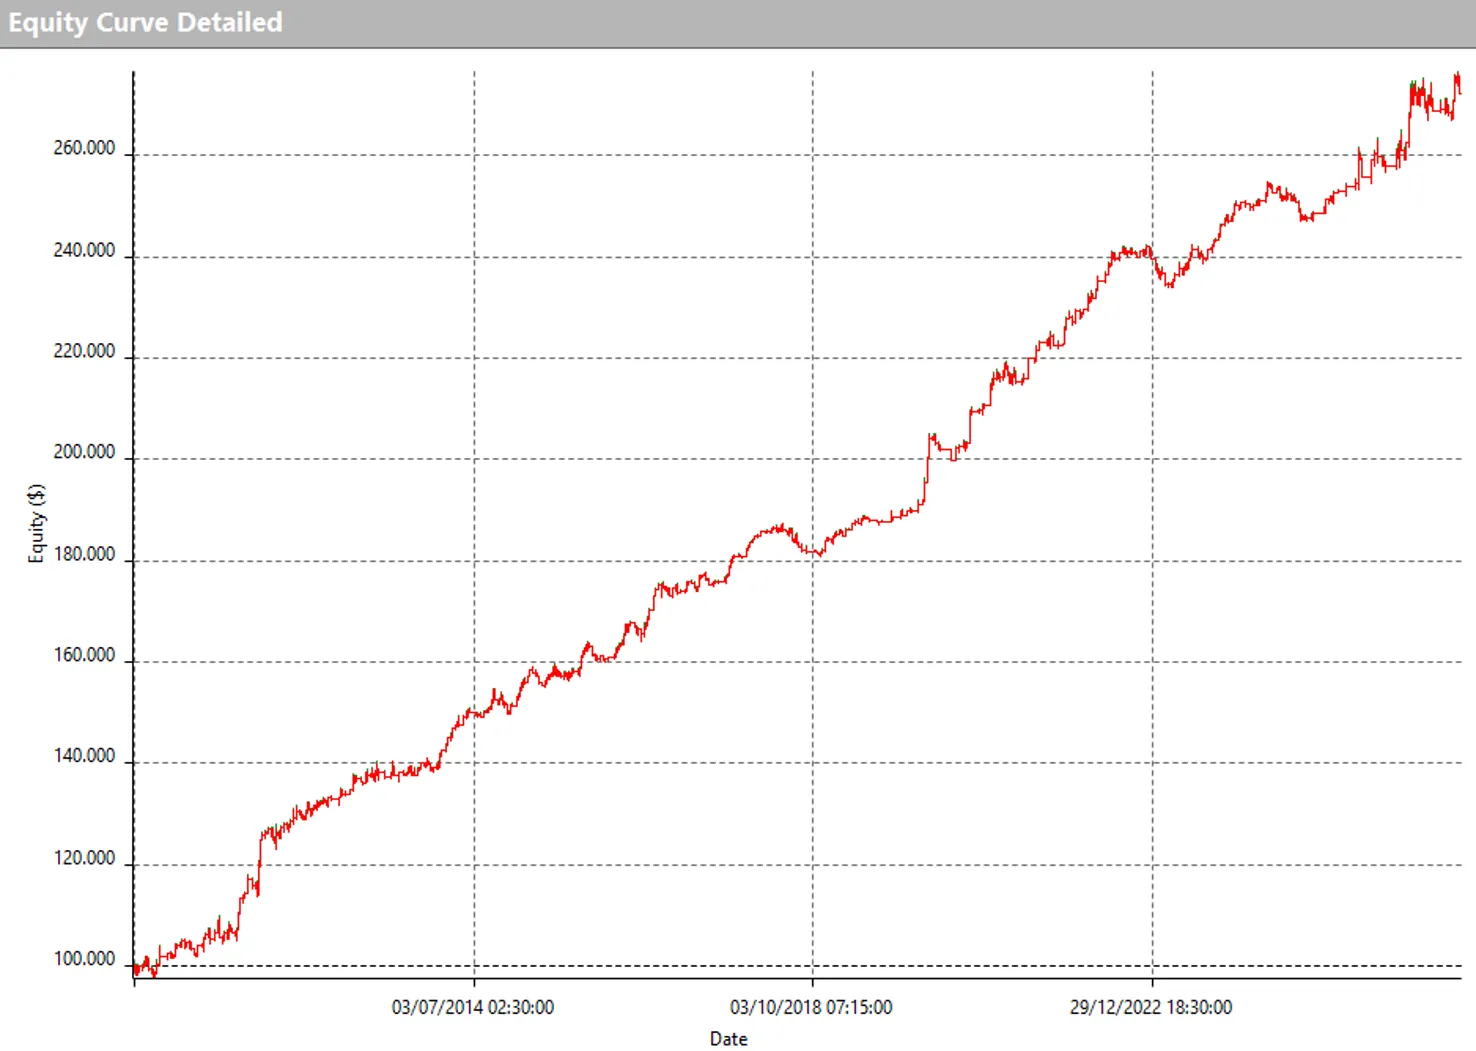
Figure 3 shows an equity curve that rises overall, though growth is less consistent in the earlier part of the historical record. Performance accelerates in more recent years, particularly from 2020 onward, and total historical profit exceeds $200,000.
Figure 4 shows a different trade profile from that of the first strategy. The total number of trades falls to 498, while the win rate rises to 55.62%. The average trade is approximately $438, with an average winner of about $1,626 and an average loss of about $1,215.
The ratio of average win to average loss is 1.34, lower than the first strategy’s 1.76. In this case, however, a higher percentage of winning trades contributes to the overall result. Long trades again outnumber short trades by a wide margin, 366 to 132, while average profit per trade is positive on both sides.


Two Ways to Develop Nasdaq Trading Strategies
These two strategies illustrate why win rate alone is not enough to evaluate a trading system. The first wins 36.49% of its trades but has an average winner larger than its average loser. The second wins more than 55% of its trades, while its ratio of average win to average loss is lower. To understand either result, we need to consider the win rate, the size of winners and losers, and the average result per trade together.
There is another lesson for strategy development here: the same starting idea can lead to different systems. Both strategies wait for a significant move away from the Nasdaq session open. One measures that move with ATR; the other uses the previous session’s range. Applying a familiar idea in a different way can provide a starting point for developing and testing new strategies.
Want to learn how to build and evaluate systematic trading strategies using a structured method? Click the button below to book a strategy session with our team. You can discuss where you are now and find out which path may best fit your goals.