
The Sortino ratio measures a strategy’s return relative to how far its returns fall below a predefined minimum target. Unlike the Sharpe ratio, it does not directly include fluctuations above that target in its risk measure.
This can make it useful when analyzing strategies with asymmetric returns, including some breakout and trend-following strategies. However, a high Sortino ratio does not establish whether a trading system is robust, profitable after costs, or suitable for the available capital.
Evaluating a strategy requires additional information: average trade, commissions and slippage, drawdown, capital requirements, and backtest quality.
This article explains how to calculate the Sortino ratio, how it differs from the Sharpe ratio, and what to consider before using it to compare trading systems.

What Is the Sortino Ratio?
The Sortino ratio is a measure of risk-adjusted performance. It compares the average return above a target with downside deviation, which measures shortfalls below that target.
The formula used in this article is:
Sortino ratio = (Average return – Minimum acceptable return) / Downside deviation
The minimum acceptable return, or MAR, is the threshold used to evaluate results. It might be 0%, for example, or a return target that reflects an investor’s requirements.
The MAR does not necessarily equal the risk-free rate. It must also match the frequency of the returns being analyzed: monthly return data requires a corresponding monthly target.
Downside deviation measures shortfalls below the MAR. With a positive MAR, even a positive return can contribute to measured downside risk if it falls short of the target.
The Sortino ratio therefore measures more than losses: it measures returns that fall below a selected threshold.
How Do You Calculate Downside Deviation?
To calculate downside deviation from a series of returns:
- Subtract the MAR from each return.
- Keep negative differences and replace positive differences with zero.
- Square each difference.
- Calculate the average of the squared differences across all observed periods.
- Take the square root.
Under the convention used here, the denominator is the total number of observations, including those that contribute zero. Dividing only by the number of periods below the MAR produces a different result.
Before comparing values from different platforms or reports, check how each calculates the indicator.
Sortino Ratio Calculation Example
Consider five hypothetical annual returns:
+30%, -5%, +22%, -12%, +25%
These are not the results of an actual trading strategy. They are used only to demonstrate the calculation. We set the MAR to 0%.
1. Calculate the Average Return
The arithmetic mean return is:
(30 – 5 + 22 – 12 + 25) / 5 = 12%
This 12% is the arithmetic average annual return, not the compound annual growth rate, or CAGR.
2. Identify Shortfalls Below the MAR
With a target of 0%, the differences used in the downside deviation calculation are:
0%, -5%, 0%, -12%, 0%
Positive returns contribute zero to downside deviation.
3. Calculate Downside Deviation
Using returns expressed as decimals:
Downside deviation = square root of ((0.05² + 0.12²) / 5)
The result is approximately 0.05814, or 5.81%.
4. Calculate the Sortino Ratio
Sortino ratio = 12% / 5.81% = approximately 2.06
This value describes the relationship between the average return above the MAR and downside deviation in the observed sample.
However, five annual returns represent a small sample. This example demonstrates the formula but cannot establish a strategy’s reliability.
Sortino Ratio vs. Sharpe Ratio: What’s the Difference?
The Sharpe ratio compares the average return in excess of the risk-free rate with the standard deviation of excess returns. When the risk-free rate is constant, that standard deviation equals the standard deviation of the returns themselves.
The Sortino ratio instead uses shortfalls below the MAR.
| Feature | Sharpe ratio | Sortino ratio |
|---|---|---|
| Return benchmark | Risk-free rate | Minimum acceptable return |
| Risk measure | Standard deviation | Downside deviation |
| Fluctuations above the target | Contribute to overall volatility | Do not directly contribute to downside deviation |
| Main question | How much excess return is generated relative to total volatility? | How much return above the target is generated relative to shortfalls below it? |
Let’s return to the previous example and set the risk-free rate to 0% as well.
Using a divisor of 5, the standard deviation is approximately 17.08%. The Sharpe ratio is therefore:
Sharpe ratio = 12% / 17.08% = approximately 0.70
For the same returns, we get:
- Sortino ratio: 2.06
- Sharpe ratio: 0.70
The values differ because the indicators use different risk measures. Standard deviation considers deviations from the mean in both directions, while downside deviation considers shortfalls below the MAR.
We cannot conclude that one rates the system as “strong” and the other as “weak.” Their scales are not directly equivalent.
Why Can the Sortino Ratio Be Useful for Breakout Strategies?
A breakout strategy enters a position when price moves beyond a level defined by its rules. Some of these strategies aim to capture directional moves and may produce numerous small losses alongside a smaller number of large gains.
When that pattern appears in periodic returns, overall volatility can increase partly because of unusually strong positive results.
The Sortino ratio can help distinguish this favorable variability from shortfalls below the return target.
However, breakout strategies do not all have the same return distribution. Their behavior depends on entry and exit rules, the market traded, position management, and the frequency of the data.
The distribution of individual trade profits also does not necessarily match the distribution of daily or monthly returns.
The Sortino ratio can therefore provide a useful perspective, but it is not automatically superior to the Sharpe ratio for every breakout system.
Why Evaluate Average Trade Alongside the Sortino Ratio?
Average trade is the average profit or loss per completed trade:
Average trade = Total profit or loss across trades / Number of trades
To interpret it correctly, you need to know whether the results already include commissions and slippage.
Slippage is the difference between the expected execution price and the actual fill price. It can have a significant impact, especially on strategies that trade frequently or during fast market moves.
If average trade is calculated before costs, compare it with a realistic estimate of the total cost per completed trade. If costs are already included, do not subtract them again.
In his article on Walk-Forward Analysis, Andrea Unger discusses average trade as an evaluation metric and contrasts his preference with the emphasis many traders place on profit factor.
The practical point is that a performance metric calculated from returns before costs may describe an edge that shrinks or disappears in live execution.
The Sortino ratio should therefore also be evaluated using returns that account for relevant costs. Average trade helps show how sensitive the results are to those assumptions.
Sortino Ratio and Drawdown Measure Different Risks
Drawdown measures the decline in equity from a previous peak to a subsequent low.
Downside deviation measures return shortfalls below a threshold. It does not measure the cumulative loss from an equity peak or the time needed to recover.
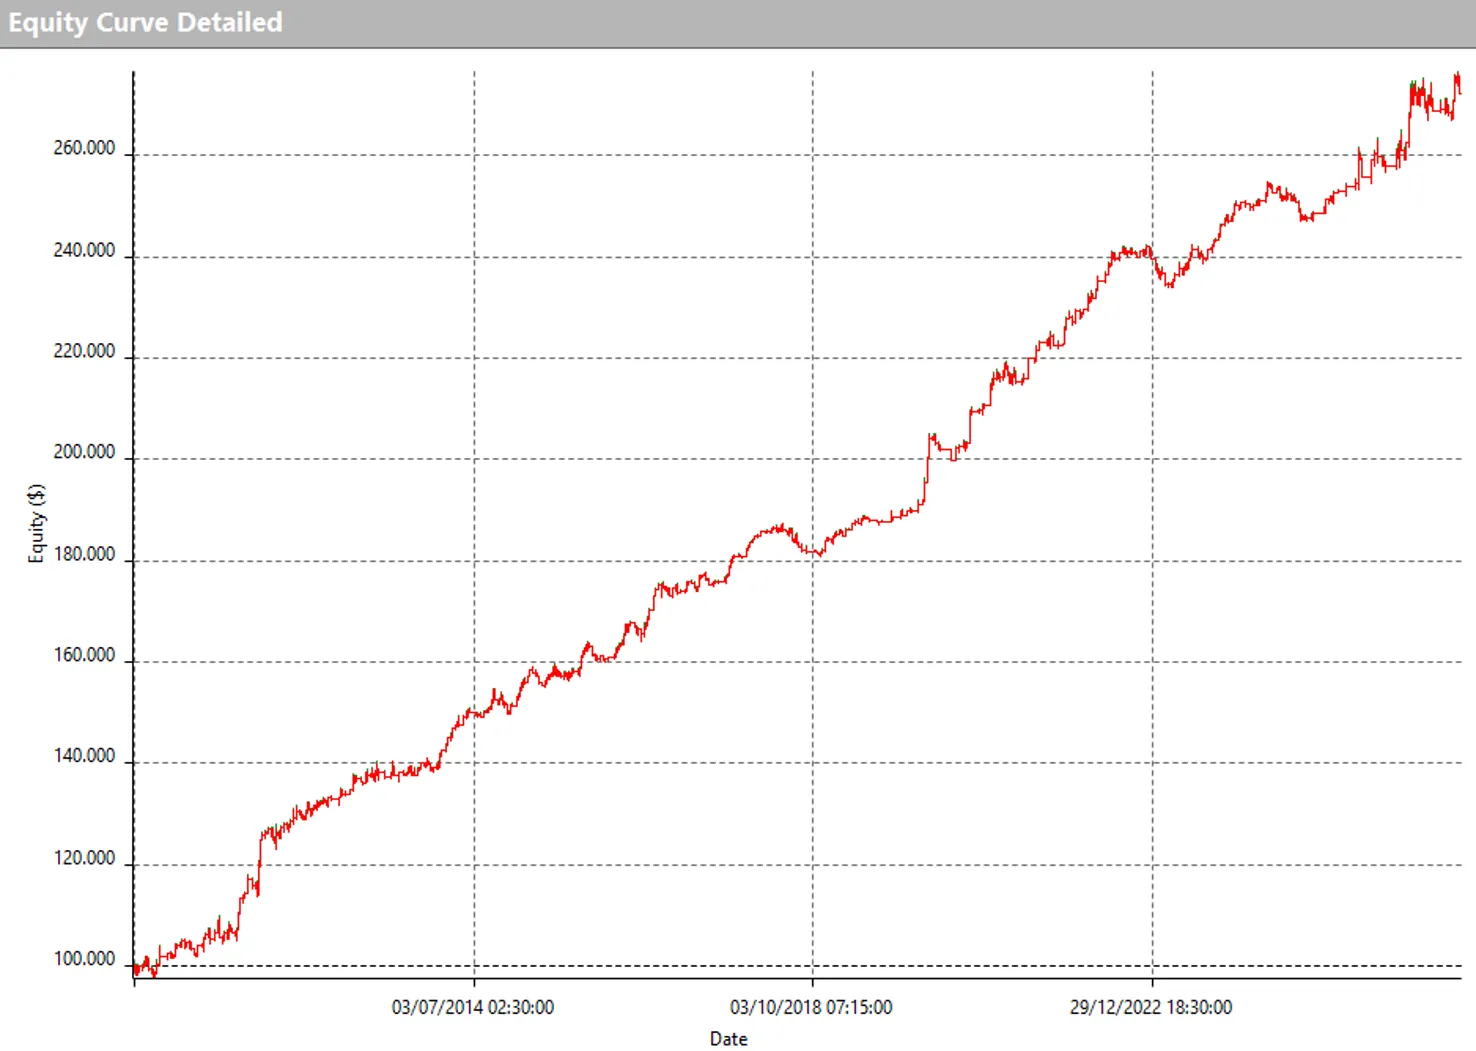
The order of returns matters. A series of consecutive losses can produce a different drawdown than the same losses interspersed with gains, even though the Sortino ratio calculated from those returns remains unchanged.
When evaluating a trading system, examine:
- Maximum drawdown in dollars.
- Percentage drawdown relative to equity.
- The duration of drawdowns and recovery periods.
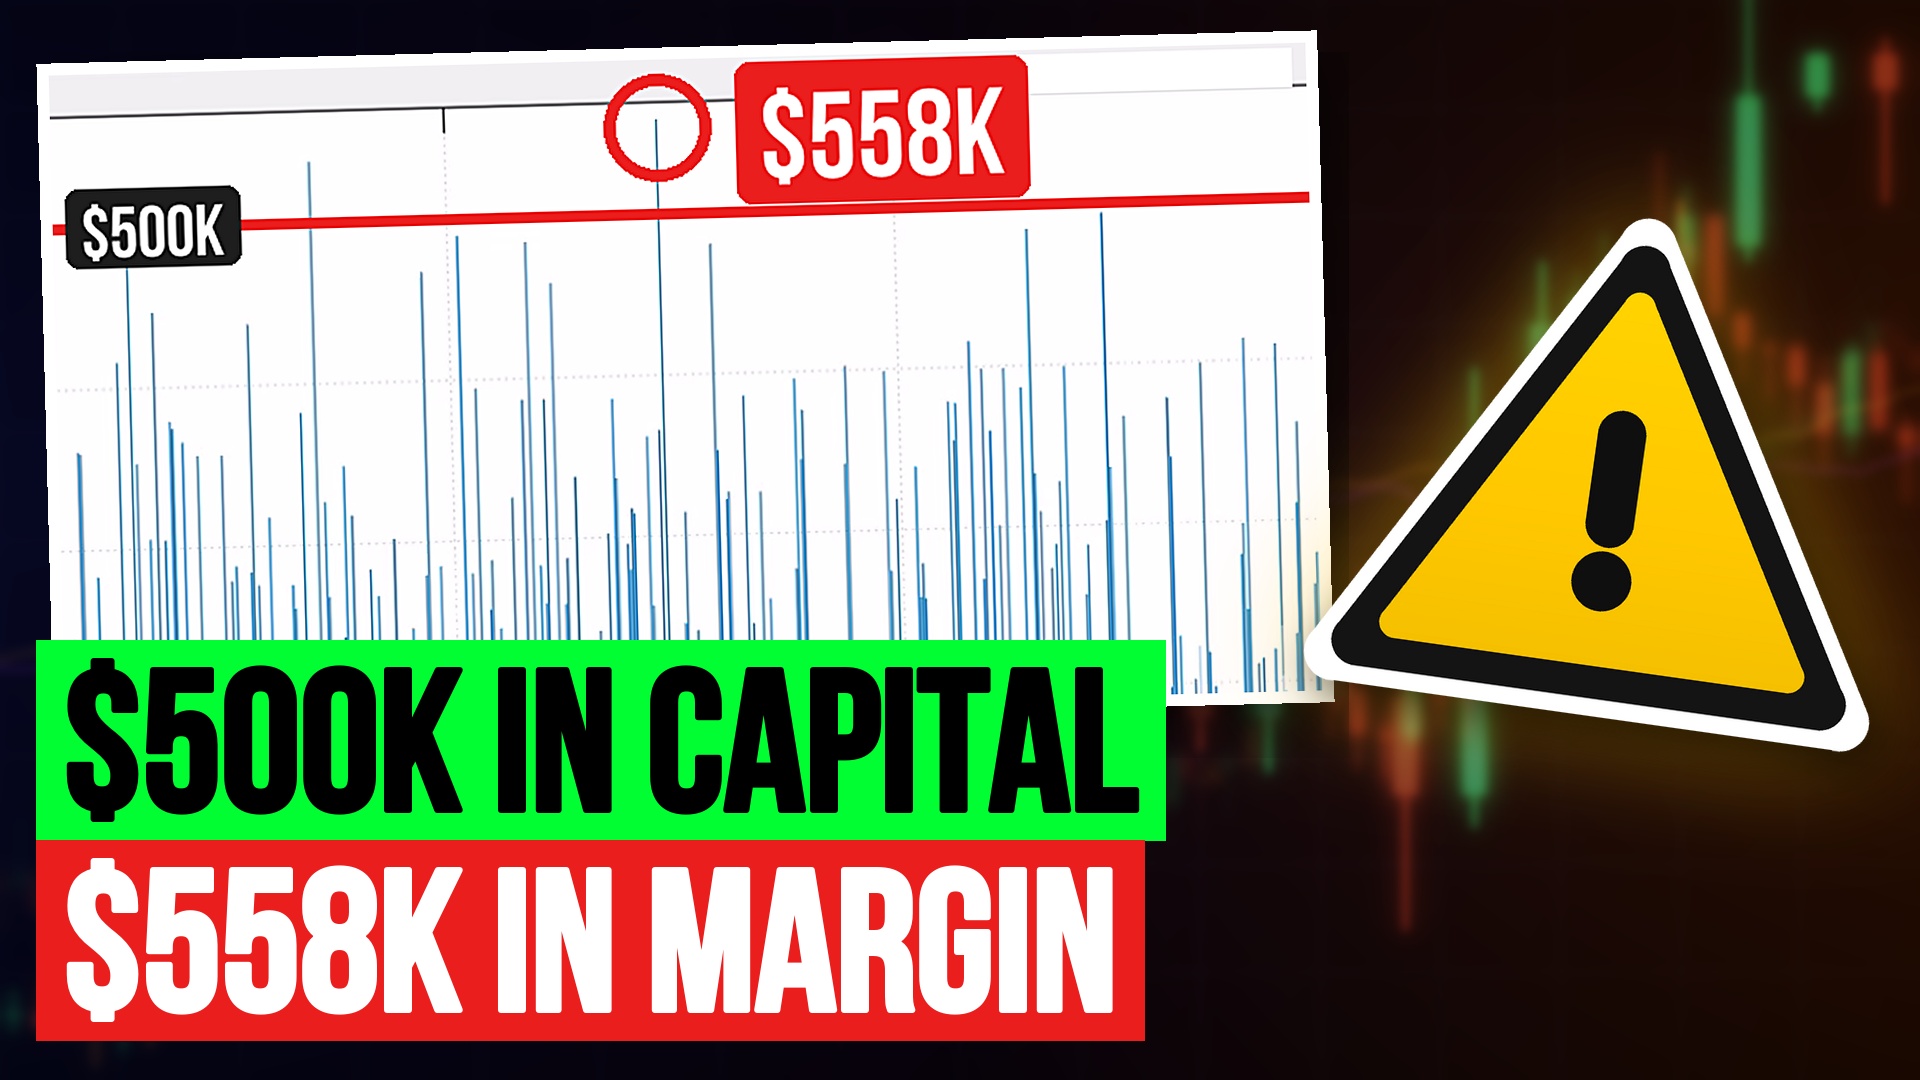
- The capital and margin required to maintain positions.
The ratio of total net profit to maximum drawdown can also provide useful information, as long as it is considered alongside the length of the test. Profit accumulated over 20 years is not directly comparable to profit accumulated over three.
When both the numerator and denominator are monetary amounts, the ratio is dimensionless. It is not expressed in dollars.
Available capital remains an essential part of the evaluation. It should be considered when selecting a strategy.
What Is a Good Sortino Ratio?
There is no universal threshold that makes a Sortino ratio “good” for every strategy.
With the calculation method, MAR, data frequency, and evaluation period held constant, a higher value indicates a higher ratio of return above the target to downside deviation.
A few mathematical reference points help explain the result:
| Value | Meaning |
|---|---|
| Negative | Average return is below the MAR |
| Zero | Average return equals the MAR, provided downside deviation is positive |
| Positive | Average return exceeds the MAR |
| Equal to 1 | Average return above the MAR equals downside deviation |
A high value does not establish that a strategy is robust. It may also reflect a short sample or very few observations below the target.
Similarly, a Sortino ratio above 3 does not automatically indicate overfitting. Overfitting must be assessed by examining how the strategy was developed, how many variations were tested, how stable its rules are, and how it performs on data that was not used to select those rules.
If no return falls below the MAR, downside deviation is zero and the ratio is not defined as a finite number. This does not mean the strategy has no risk.
How to Compare Sortino Ratios Correctly
Before comparing two values, check that at least the following factors are consistent:
- MAR: The same minimum return target.
- Frequency: Daily, monthly, or annual returns.
- Period: Comparable evaluation windows.
- Costs: Consistent treatment of commissions, slippage, and other expenses.
- Method: The same downside deviation and annualization conventions.
- Returns: Consistent equity calculations and treatment of deposits and withdrawals.
A nonannualized monthly Sortino ratio should not be compared directly with an annualized value.
Annual returns can also hide substantial fluctuations and drawdowns that occurred during the year. When positions remain open, check how equity incorporates unrealized profits and losses.
A metric is comparable only when you understand how it was calculated.
How to Use the Sortino Ratio in Backtest Analysis
Start with a reliable backtest based on appropriate data, verifiable rules, and realistic execution assumptions.
On that foundation, the Sortino ratio can complement the evaluation:
- Examine the strategy’s logic and robustness. Check how heavily the results depend on choices made during development.
- Review costs and average trade. Assess sensitivity to higher commissions and slippage.
- Analyze drawdown and capital requirements. Consider position sizes, margin requirements, and the ability to withstand losses.
- Read the Sortino and Sharpe ratios together. Use them to examine different aspects of return variability.
The Sortino ratio helps describe historical results relative to a target. It does not replace an assessment of operational risks or guarantee that the observed behavior will continue.
Frequently Asked Questions About the Sortino Ratio
What Is the Difference Between the Sortino Ratio and the Sharpe Ratio?
The Sharpe ratio uses the overall volatility of returns in excess of the risk-free rate. The Sortino ratio uses shortfalls below a minimum acceptable return. The two indicators describe different aspects of risk.
Is the Sortino Ratio Better for Breakout Strategies?
It can be useful when periodic returns include large gains and exhibit positive skewness. However, classifying a strategy as a breakout system is not enough to determine which indicator is more appropriate.
Does a High Sortino Ratio Mean Low Drawdown?
No. Downside deviation does not measure the cumulative loss from an equity peak. Sortino ratio and drawdown should be analyzed separately.
Does the Sortino Ratio Include Commissions and Slippage?
Only if the returns used in the calculation include those costs. The indicator does not account for them automatically.
Does a Very High Sortino Ratio Indicate Overfitting?
Not necessarily. It warrants a review of the sample and methodology, but overfitting cannot be diagnosed from a single value.
Can You Calculate the Sortino Ratio When No Returns Fall Below the MAR?
If downside deviation is zero, the ratio is not defined as a finite number. The absence of below-target returns in the sample does not establish the absence of future risk.
Trading involves a substantial risk of loss and is not suitable for all investors. Past performance, including simulated backtest results, does not guarantee future results. This article is for educational purposes only and does not constitute financial advice.