Need More Help? Book Your FREE Strategy Session With Our Team Today!
We’ll help you map out a plan to fix the problems in your trading and get you to the next level. Answer a few questions on our application and then choose a time that works for you.
We are traders, we look for trends, no matter how long, long enough to ride them and take some money out of the markets, it looks easy… well it isn’t.
Reading Technical Analysis books and papers we often find strong trend indicators in defined moves and clear extensions, so we may get confused and consider those are the chart patterns we have to look for to enter the market.

A candle with a clearly defined body may well identify a strong will to trend in the direction the prices showed; but the truth is that this is not an immediate indication to enter the market.
In fact markets are like human beings, they decide after having had indecision, they run after having had a rest.
To see if actually a message of indecision is a better information then strong decision let’s test a very simple system with different setups.
The action we will take in our system is, on daily bars, to buy the breakout of yesterday’s high and to exit the position on close.
The first setup will have no particular conditions, it will buy the breakout regardless of any setup.
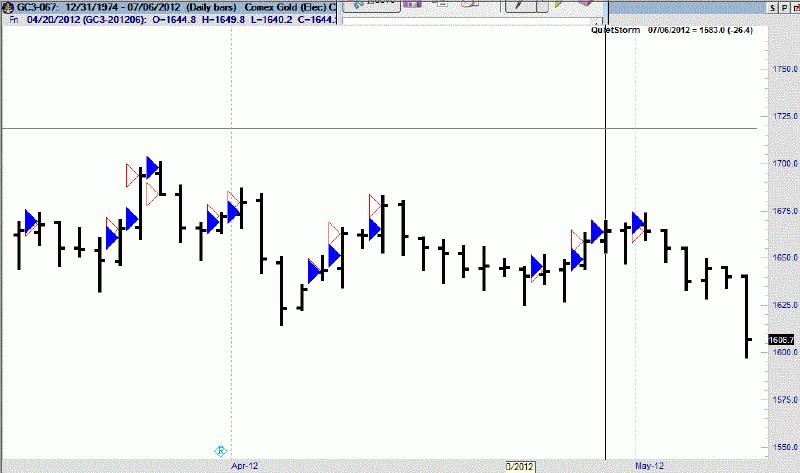
In the picture below you can see some examples of trade on Gold Future
Fig. 2: Examples on Gold Future, trades are opened at breakout of previous high and closed at the end of the day
We can test this system on a basket of instruments:
- Crude Oil Future
- British Pound Future
- Gold Future
- Heating Oil Future
- Sugar Future
- Corn Future
- Wheat Future
- Bund Future
- EuroFX Future
- Dax Future
- Coffee Future
- Silver Future
- 10 yrs T-Notes
- Australian Dollar Future
- Japanese Yen Future
- Copper Future
- Natural Gas Future
- 30 yrs T-Bond
- Soybeans Future
The tests are run without considering slippage and commissions as the purpose is not to build a winning system but to compare market behavior.
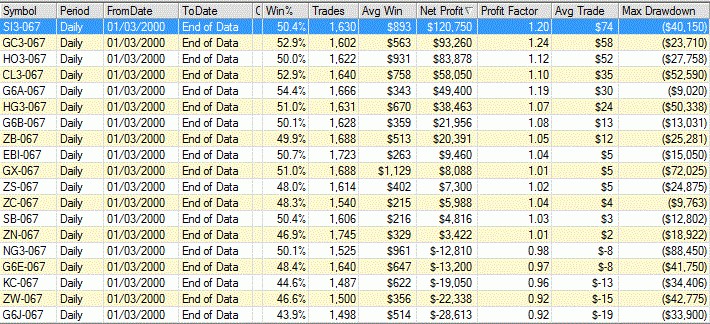
The entry without particular constraints shows to be profitable on most markets but there are also some where losses are shown:
Fig. 3: Silver shows to be the best performing instrument for this approach while Japanese Yen Future is the one where we see the highest losses
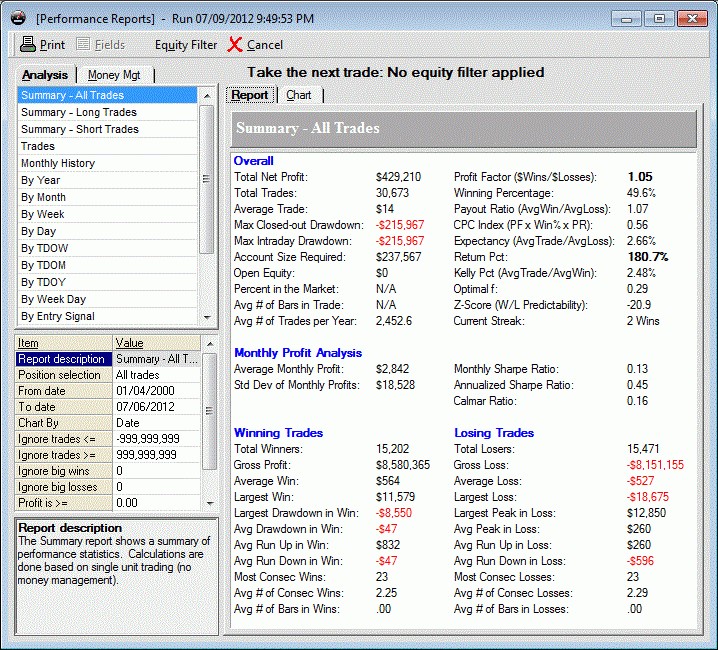
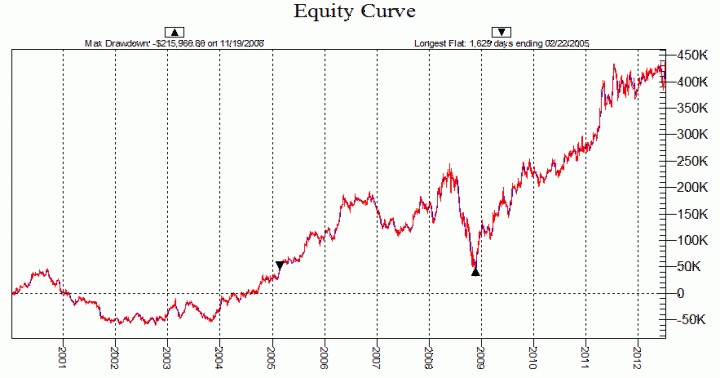
Here is the Performance Report and the Equity Line of all these markets together:
Fig. 4 : Merged Performance Report, there are gains but the drawdown is certainly too high and the average trade of only 14 USD is absolutely not tradable
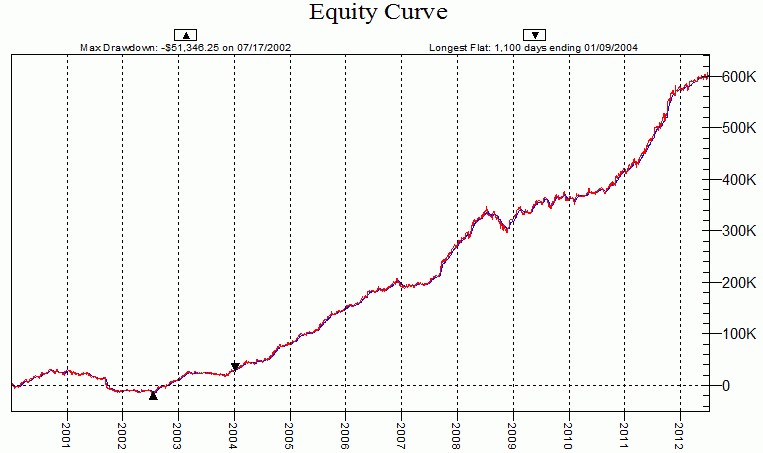
Fig. 5: The Equity Line is not vey nice
We can also have a more detailed look at the best and worst report:
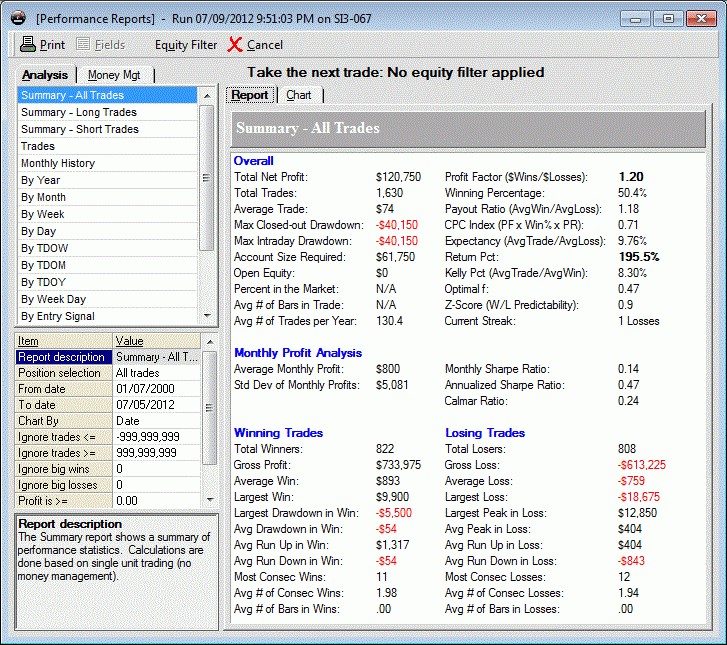
Fig. 6: Silver shows interesting profits using this simple method
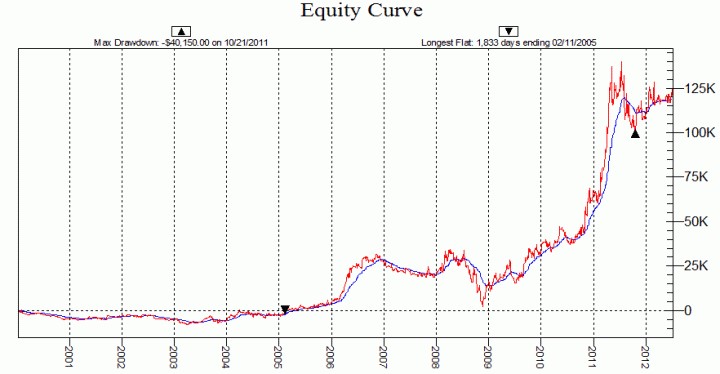
Fig. 7 : The Equity Line is in any case not the best that could be desired
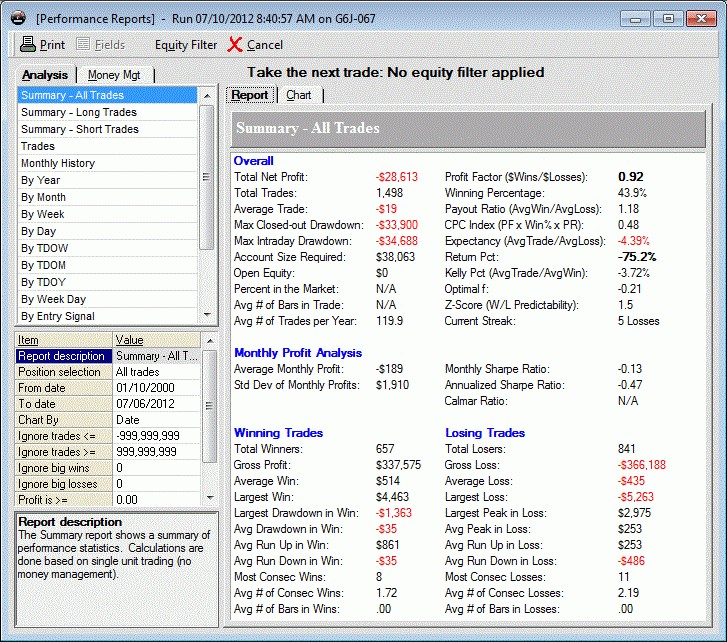
Fig. 8. Japanese Yen is definitively losing with the proposed entries
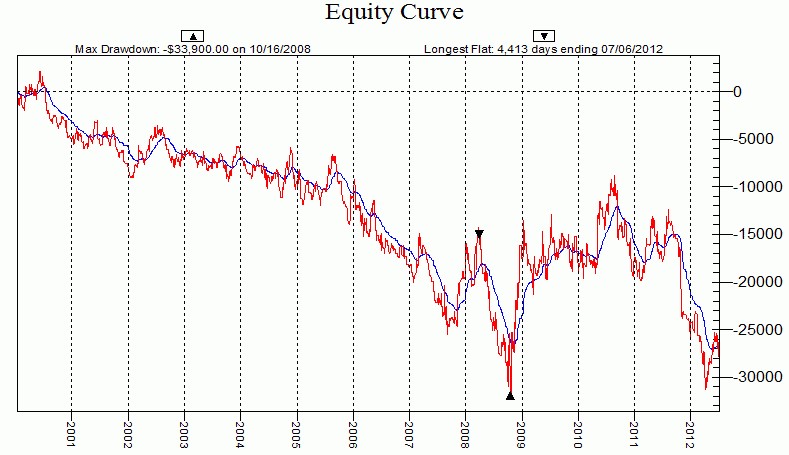
Fig. 9 : A bad Equity Line witnesses what we saw in the report
Now we go into our demonstration and we consider the assumption that it might well be true that candles like the one shown in Figure 1 indicate a trend; but our idea is that after such a day there is not immediately much left, this means we’d prefer to follow our breakout only after days where indecision is shown, that is, days where the distance between open and close is much less then the whole range.

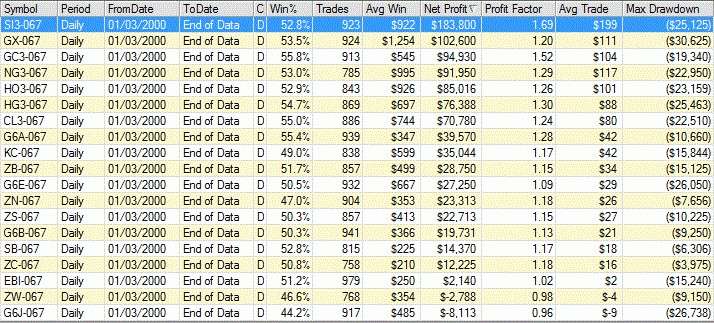
The first setup we can test is to place trades only if the distance between open and close of the day before, is less then 50% of the whole range. Here are the results on the basket of instruments we chose for our tests:
Fig. 11: to Trade only after a day with indecision shows much better results on al the instruments we are testing
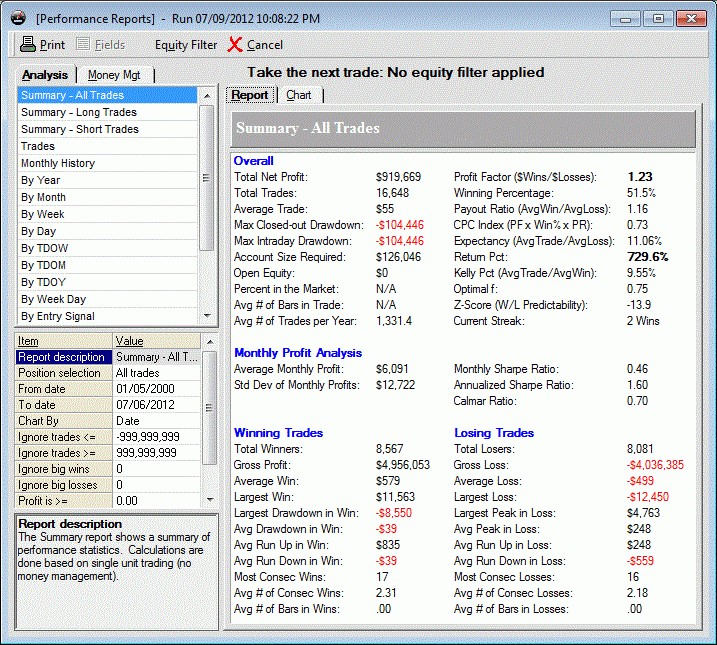
And here is the Performance Report and the Equity Curve
Fig. 12: the number of trades reduced to one half but the profits are more then double!
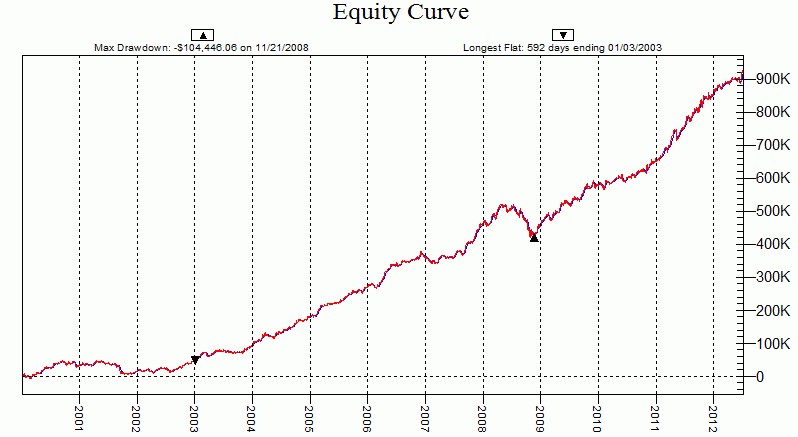
Fig. 13: also the Equity Line has a much better shape
The results are pretty interesting, to demonstrate that filtering trades with an indecision pattern we can also go to extreme levels where the difference between open and close of the day is less then 25% of the whole range and take trades only in this case.
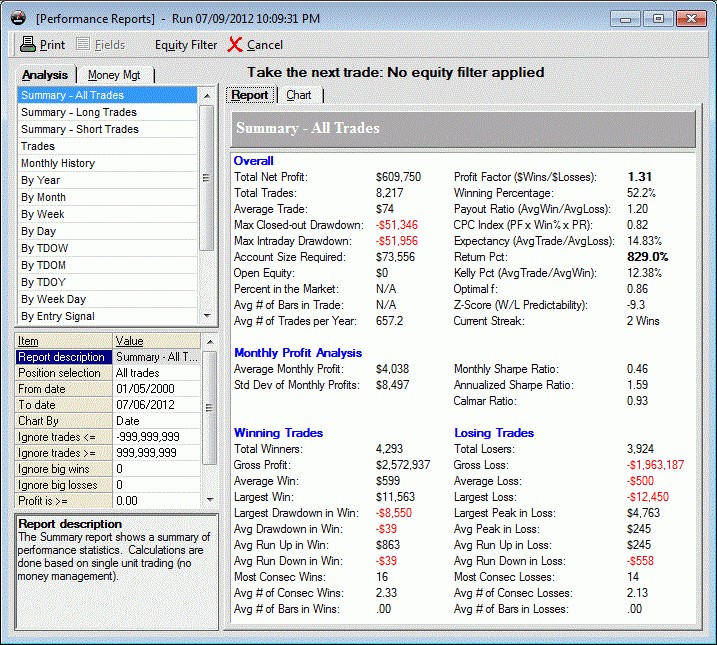
Here are Performance Report and Equity Curve
Fig. 14: we are losing one third of performance but looking at the average trade and at the drawdown we notice a real improvement in the quality of these results
Fig. 15: The Equity Line shows a constant growth
Conclusions
A very simple rule that tries to ride an intraday trend leads to positive results. The intraday trends we are looking for are anyway more effective after days where the market showed indecision, filtering trades entering only after indecision (measured with the ratio between the body and the range of the candle) leads to better and more robust results.
Transcription
Need More Help? Book Your FREE Strategy Session With Our Team Today!
We’ll help you map out a plan to fix the problems in your trading and get you to the next level. Answer a few questions on our application and then choose a time that works for you.

