Even if you are a complete beginner in the trading world, you likely already heard of technical analysis. And if you investigated it a little further, you likely noticed that there are widely differing opinions about it.
Some enthusiastically affirm that technical analysis is a discipline that guarantees incredible results on the markets.
Others, believe that it offers no competitive advantage to traders and should therefore be avoided altogether.
In this article, we will try as always to strike a balance between these extreme views. We will explore the definition of technical analysis, what the different approaches and instruments are, and lastly try to understand how important technical analysis is to succeed in the market.
What Is (and What Isn’t) Technical Analysis
Technical analysis identifies trading transactions through statistical analysis of market prices and volumes.
The philosophy behind this approach is that a trader can use past data to better interpret the present. For example, if a stock shows certain behaviors for an extended time, then it’s reasonable to expect that it will continue to do so in the future.
The opposite of technical analysis is fundamental analysis, which values a stock based solely on corporate performance, such as turnovers and profit margins, rather than prices and volumes.
Bottom-Up and Top-Down Approach
There are two approaches to technical analysis.
The top-down approach involves identifying individual opportunities from a global view.
A trader using a top-down approach considers the big picture, analyzing the macroeconomic factors involved and trying to guess how these might manifest in the market.
Next, the trader will evaluate the performance of the specific sector and use this knowledge to draw conclusions about the stock being analyzed.
In contrast, the bottom-up approach attempts to guess the future performance of a stock through analysis of that specific company in comparison with the rest of the industry.
Some Basic Concepts of Technical Analysis
The Charts
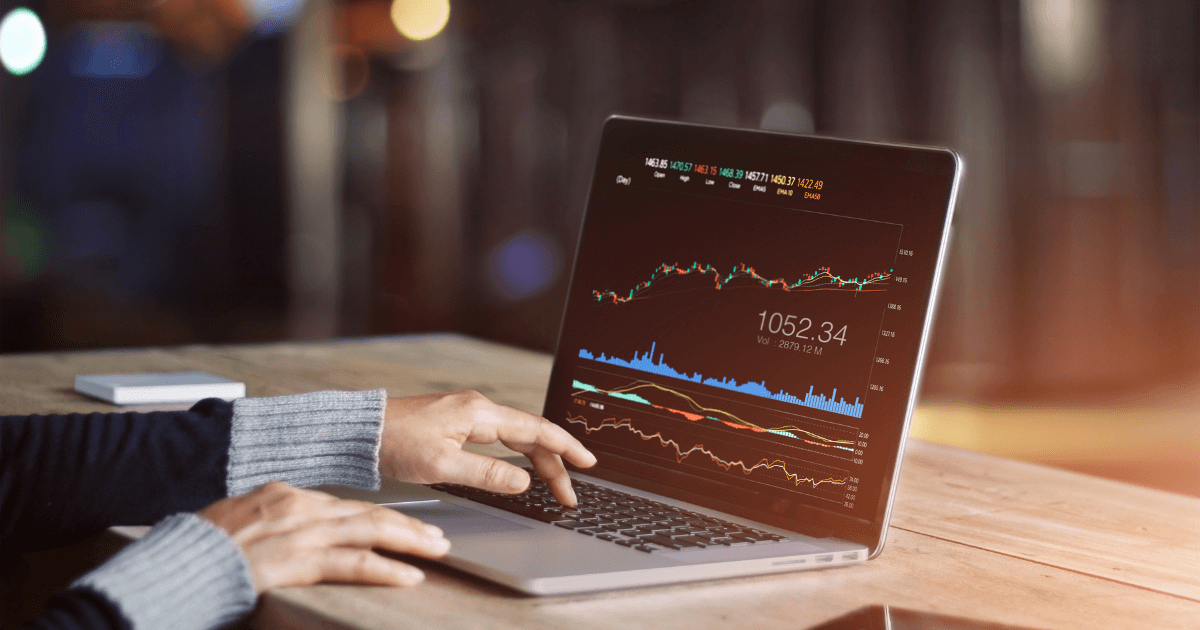
Charts are key instruments for a trader, as they provide an overview of market trends and thus enable informed decisions for the future.
There are several types of charts, including linear charts, bar charts, and Japanese candlesticks. In technical analysis, these charts are analyzed using instruments such as indicators.
Indicators
Indicators analyze historical data to predict how the price of a financial instrument will behave in the future. As certain market conditions are realized, indicators send entry or exit signals to the trader.
There are many types of indicators, each with its pros and cons.
Price Action
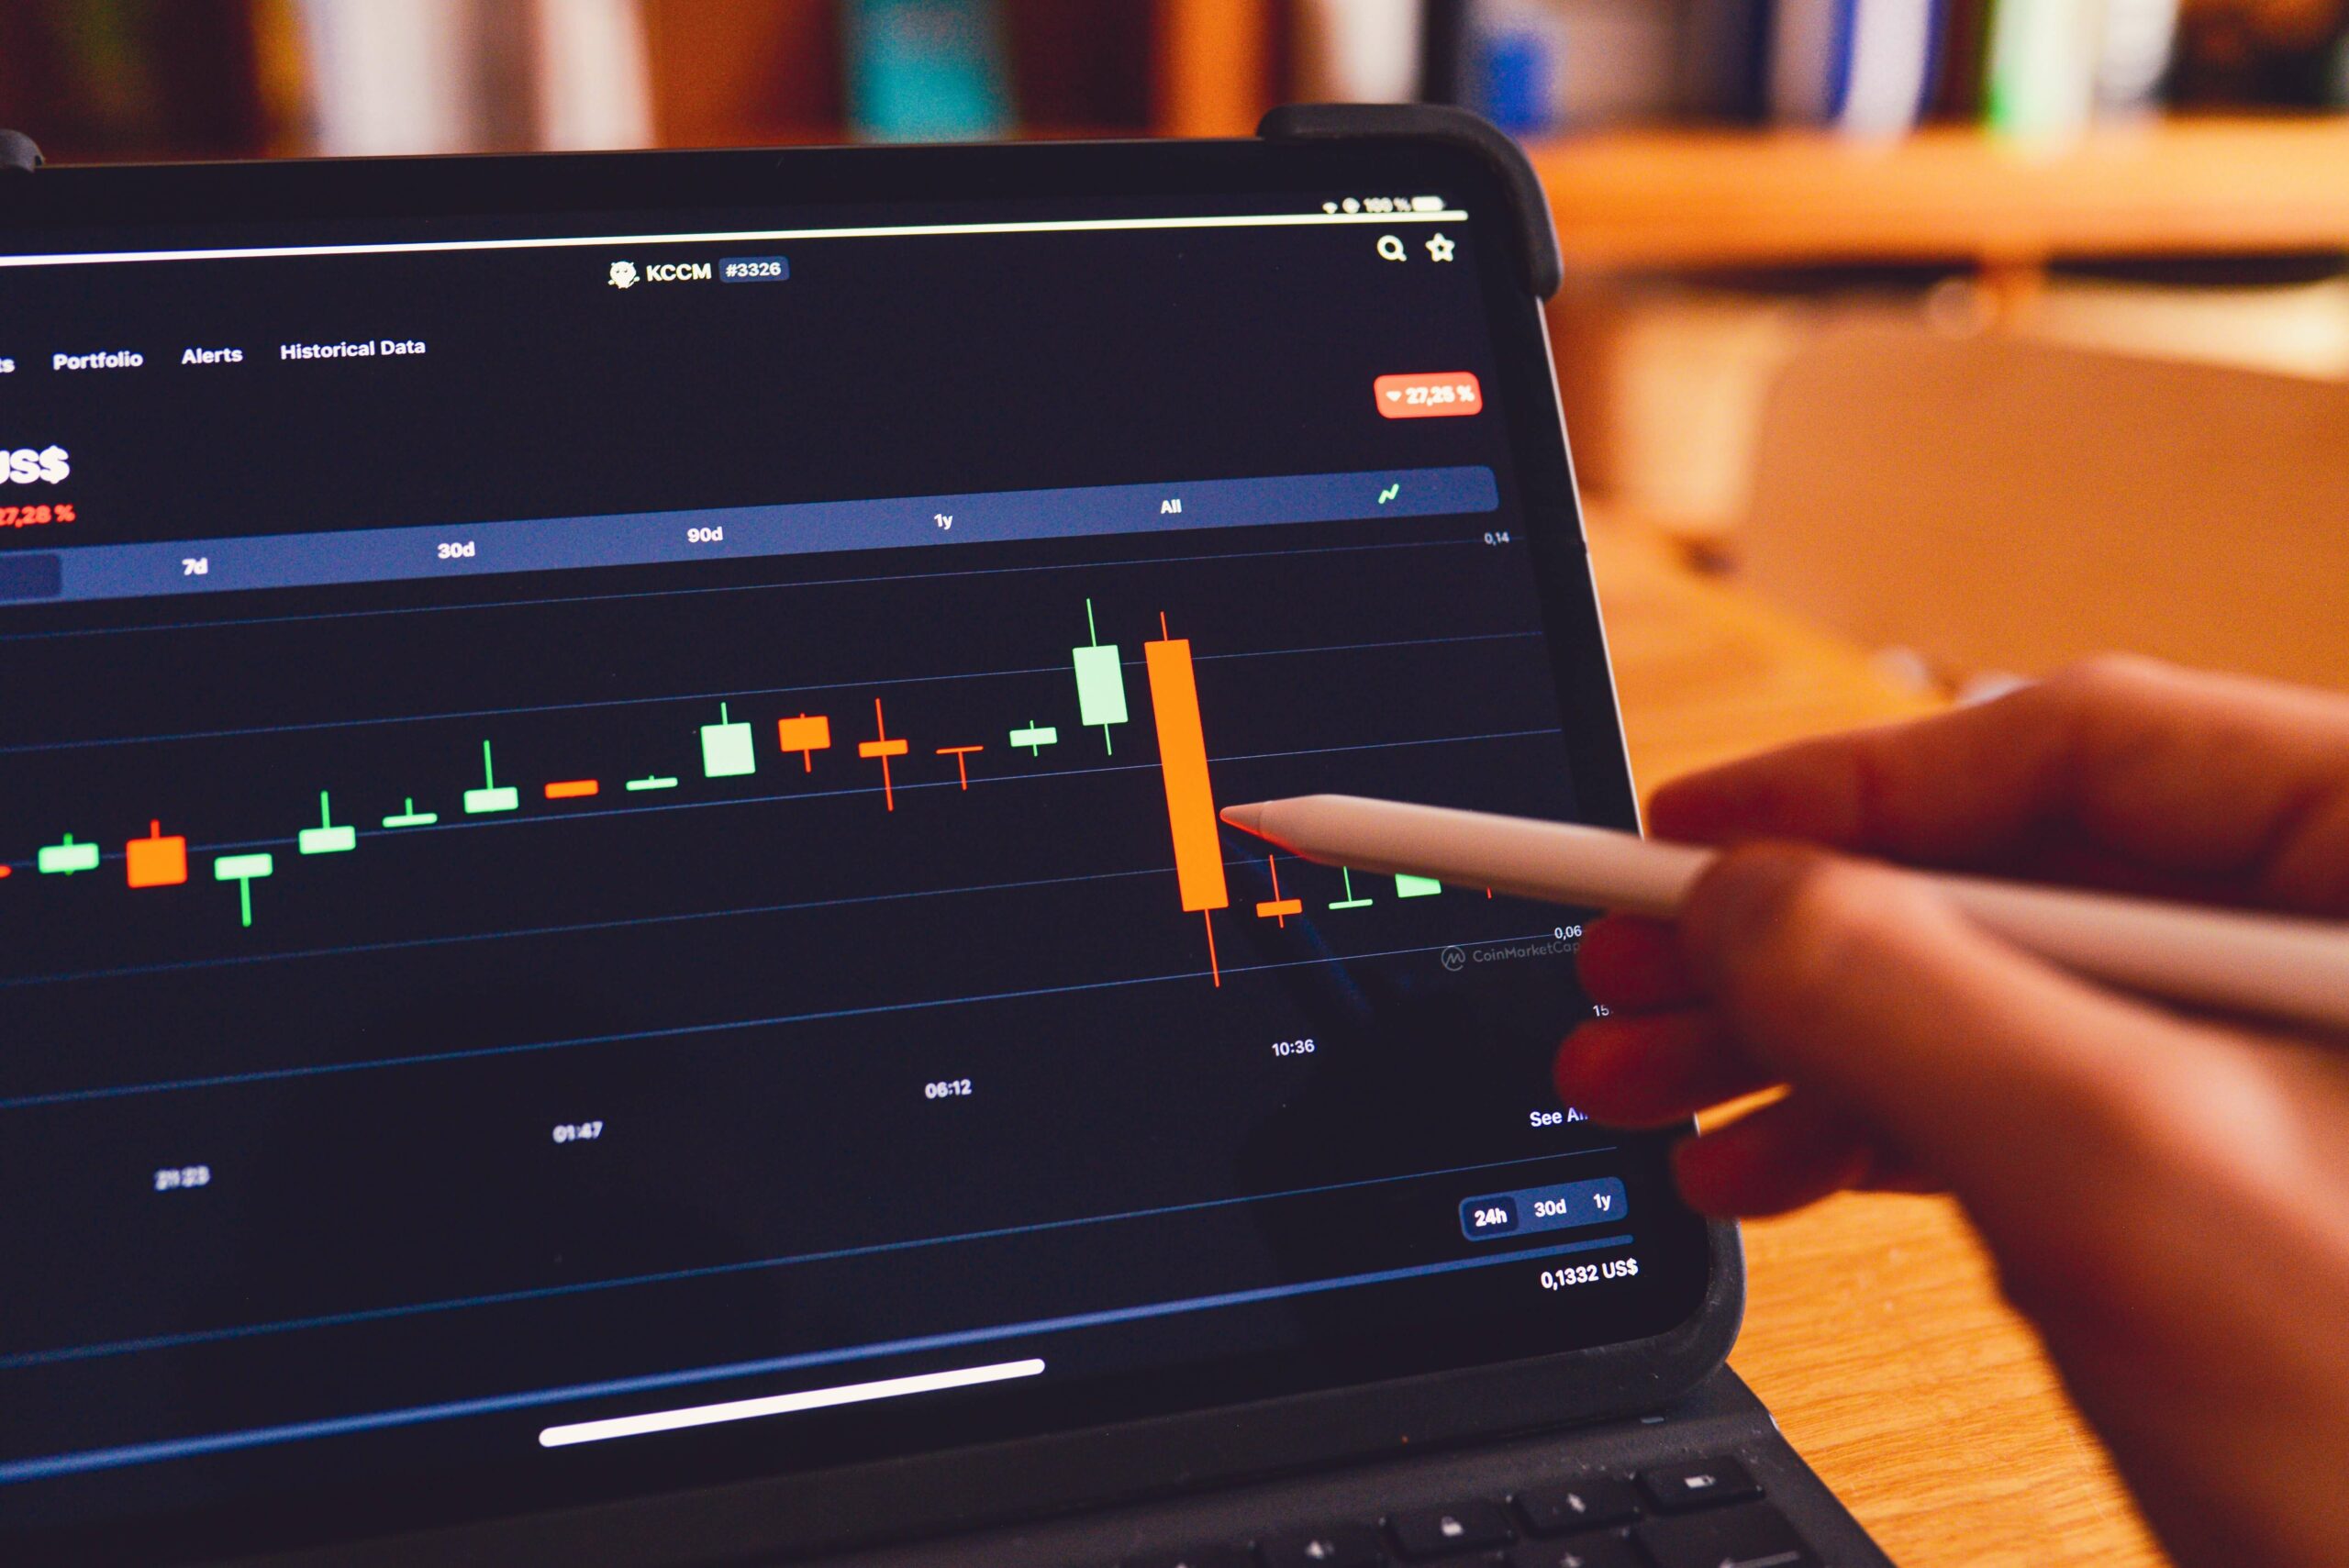
We already mentioned the importance of price in technical analysis. There is even a saying: “Price discounts everything.” This refers to the fact that the price of a stock contains all the information needed to trade successfully.
Price action is nothing more than the development over time of the price of a financial instrument.
Trend Analysis
Trends are the imbalances between supply and demand that help drive the price of a stock higher or lower. Some traders prefer trend-following strategies, or strategies that ride trend movements, while others prefer to trade in the opposite direction of the trend.
Support and Resistance Levels
Support and resistance levels are identified through trend analysis. Support is a level where the downward trend in prices is expected to stop. Resistance, represents the opposite, the level at which the bullish price movement is expected to stop.
Of course, support and resistance levels don’t represent absolute certainties, but thresholds that have been effective in the past.
Overbought and Oversold
A stock is considered overbought when its price rises sharply and a period of decline or consolidation is expected to follow.
Conversely, a stock is oversold when the price of a financial instrument falls sharply and a period of increase or accumulation is expected.
Certain indicators identify these levels, for example, the RSI (Relative Strength Index). The closer the RSI value is to 100, the more overbought the market is. As the RSI approaches 0, the more the market is in an oversold condition.
Is It Worth Using Technical Analysis?
If you’ve read other articles on our blog before, you may have seen that we at Unger Academy rely on systematic trading rather than technical analysis. This is because systematic trading allows us to automate our strategies, limit the impact of emotions on our trading, and spend less time in front of the screen.
However, we are well aware of the potential of technical analysis. Therefore, we test the basic formulas and technical analysis instruments inside our trading systems, separating what works from what does not.
To summarize our views on technical analysis, our goal is to use some aspects of technical analysis within systematic trading. Indeed, we believe that applying a systematic approach to the basic formulas of technical analysis can be particularly useful.
Conclusion
We hope this article has helped clarify your view of technical analysis.
Of course, entire books could be written for each concept mentioned in the preceding paragraphs, but an excellent starting point for further study is our article on indicators, which we also use in our trading systems.