
The Keltner Channel is a volatility-based technical analysis indicator that can identify overbought and oversold market situations.
If this definition sounds familiar, you shouldn’t be surprised: the Keltner Channel is an indicator very similar to the better-known Bollinger Bands. However, as we’ll see below, there are some important differences.
This indicator bears the name of the trader who invented it, Chester Keltner, who in the 1960s published a rather popular book on trading entitled How To Make Money in Commodities.
In this book, Keltner popularized the original Keltner Channel formula, which featured the use of simple moving averages (or SMAs) and the high-low price range to calculate the bands that form the Channel.
In the 1980s this original formula was revised by trader Linda Bradford Raschke, who made several changes, introducing, for example, the use of the Average True Range (ATR). This modified version is to date the most widely used and popular.
How the Keltner Channel Is Formed
To better understand what it’s used for and how it can help us, let’s look at how this indicator is structured.
The Keltner Channel consists of three lines. The middle line represents the exponential moving average (EMA) of a price. The EMA is usually calculated over 20 days.
The other two lines are obtained by considering the average true range and a multiplier (which usually equals 2), and can be calculated as follows:
Upper band = EMA + (ATR x 2)
Lower band = EMA – (ATR x 2)
Both the EMA reference period and the multiplier may vary depending on your objectives. For example, if you want results that are more sensitive to price changes, you might consider a period of fewer than 20 days, or if you’re interested in having a less influential indicator, we might consider a period of more than 20 days. You can also adjust the width of the channel by considering a multiplier greater than 2 (wider channel) or less than 2 (narrower channel).
How to Interpret the Keltner Channel
As mentioned, the Keltner Channel identifies overbought or oversold conditions. In most cases, the fluctuations of a price are contained within the Channel. So, as soon as a price breaks outside the Channel, this alerts us that the trend needs to be monitored carefully.
A price that breaks the top of the Channel indicates particularly strong market conditions, that is, a bullish trend. Conversely, if the price of an asset crosses the lower part of the Channel, the market is in a bearish phase.
A systematic trader can then use this indicator to set entry or exit signals. Traditionally, you open a long position if the trend is bullish, and a short position when the trend is bearish.
Comparison to the Bollinger Bands
If you’ve already read our guide on Bollinger Bands, by now you’ve probably noticed a great similarity between these two indicators.
Both indicators are based on volatility, but the big difference is that the average true range determines the width of the Keltner Channel, whereas the width in Bollinger Bands is determined by the standard deviation.
This is an important difference because standard deviations tend to behave differently in the presence of outliers. As a result, certain price changes can affect the Bollinger Bands, causing inaccurate signals.
The Keltner Channel, though imperfect, is less affected by the presence of abnormal values and provides more accurate signals in some cases.
To see a practical example, consider the picture below:
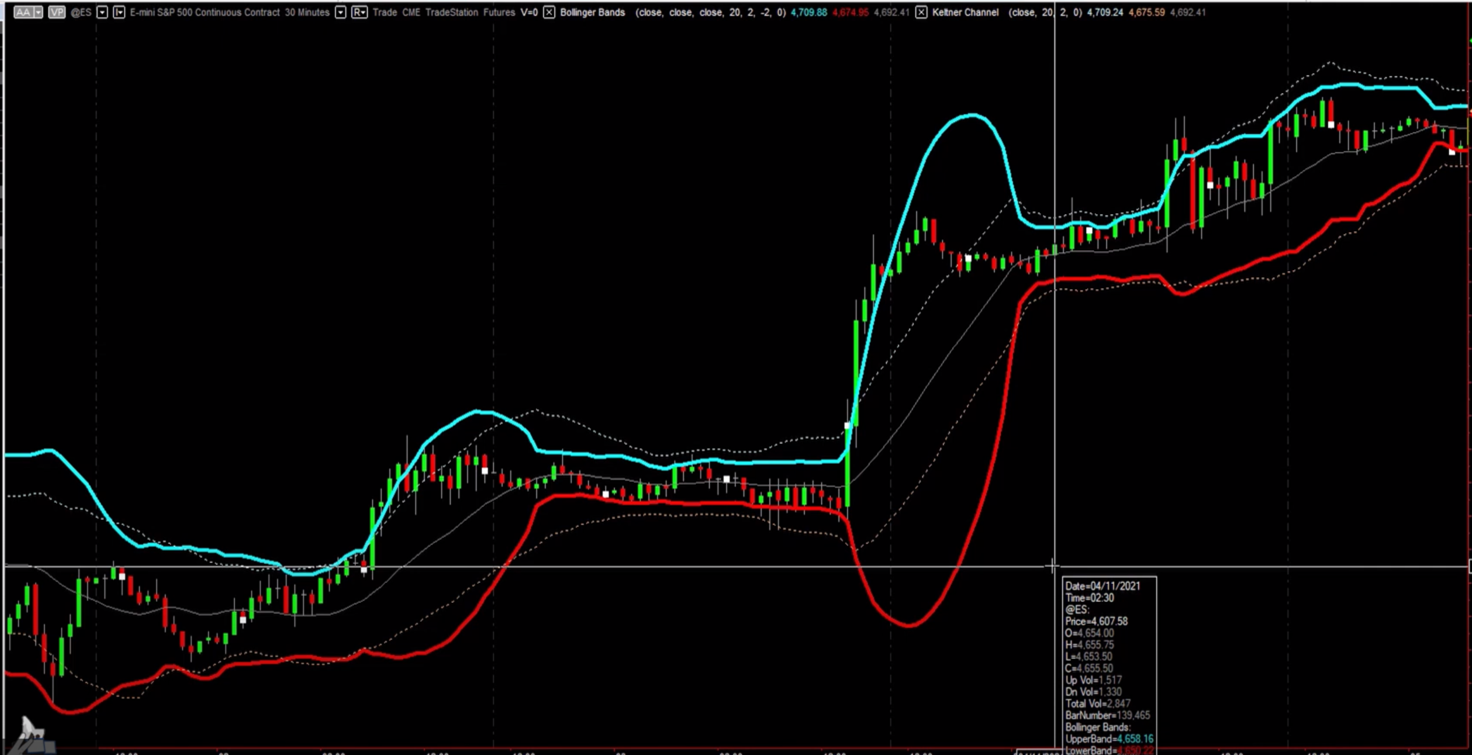
This screenshot taken from the video linked below shows both the Bollinger Bands (in blue and red) and the Keltner Channel (the three lighter lines).
As you can see, the two indicators behave in an all-too-similar way, but at some point, the asset price spikes and causes the two indicators to react differently.
To understand which of these two price channels is more effective within a trading strategy, we recommend that you watch the video below. In the video, one of our coaches compares the application of Bollinger Bands and the Keltner Channel within the same strategy.
Conclusion
Although it’s a lesser-known indicator than Bollinger Bands (and similar in many ways), the Keltner Channel shouldn’t be underestimated. As you can see in the video, this indicator has a lot of potential if used correctly in a trading strategy.
If you have any doubts left about the Keltner Channel, watch the video. If you’d like to find out more about Bollinger Bands and haven’t read our article yet, please click here.