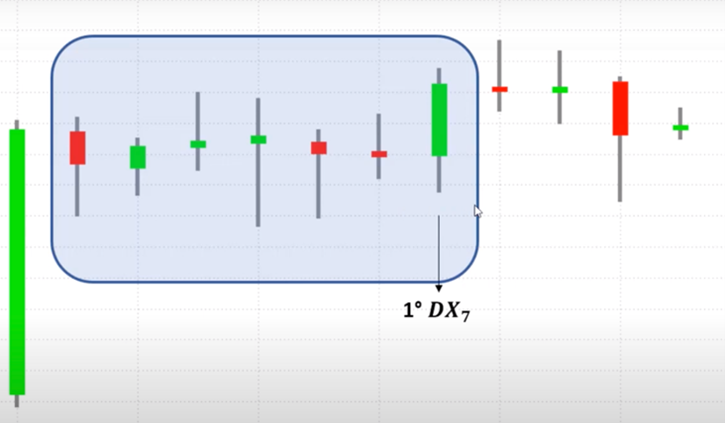
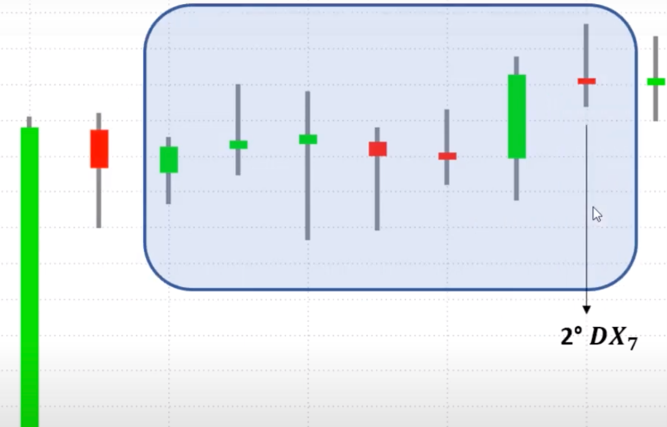
The ADX indicator, or Average Directional Index, is used to define the strength of a trend. The ADX value ranges from 0 to 100, where 0 indicates a total absence of trend (sideways market) and 100 indicates a very strong trend.
This indicator was created by John Welles Wilder, who did not just invent the ADX but also devised other popular indicators such as the Relative Strength Index, or RSI, and the Average True Range, or ATR.
Originally intended for commodities, nowadays the ADX is applied to various markets, including stocks and futures.
While providing information regarding the strength of a trend, the ADX does not calculate the direction of a trend. However, as we will see in this article, this data is actually contained in the two indicators that combine to form the ADX: the Plus Directional Index (+DI) and the Minus Directional Index (-DI).
How to Build the ADX Indicator
If you are unfamiliar with the ADX indicator, we first recommend that you watch the video below, in which one of our coaches clearly and thoroughly explains how to calculate it:
If you had difficulty following the steps described in the video, take a look at the simple step-by-step we offer below. If you have it all figured out, you can move on to the next section.
1. Identify the Directional Movement
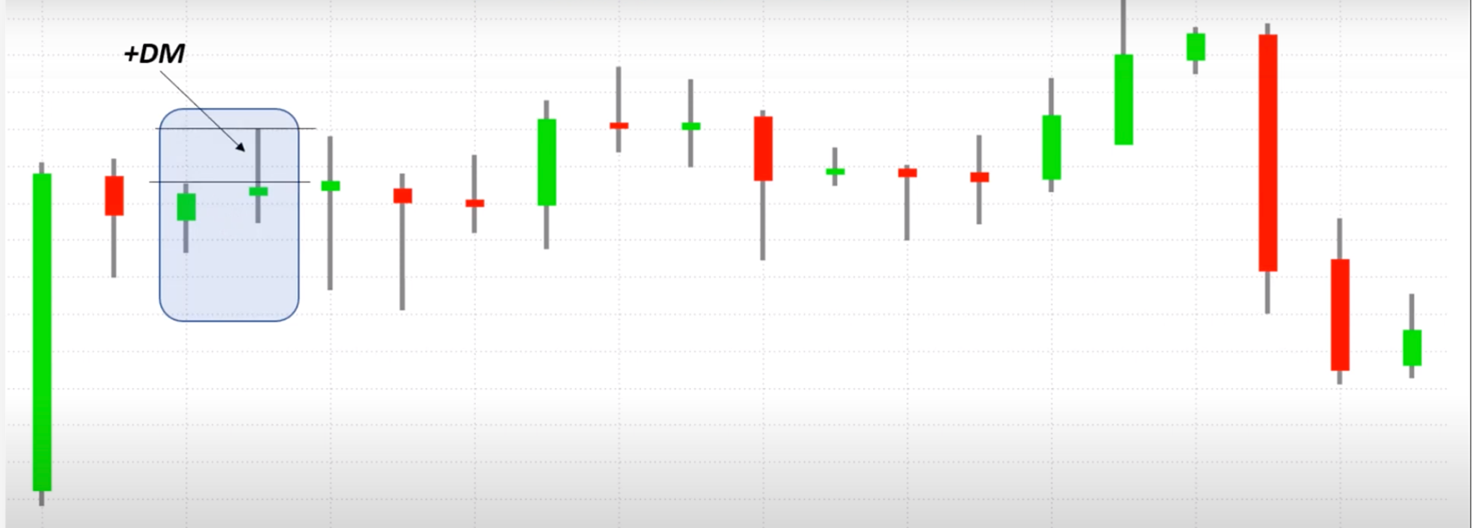
The Directional Movement is defined as the portion of bar’s range that lies outside the range of the preceding bar. There is a Plus Directional Movement (+DM) if the part of the range is above the previous bar, and a Minus Directional Movement (-DM) if the part of the range is below the previous bar.
Let’s look at some examples. As you can see, the bar indicated by the arrow has a portion of range that is above the range of the previous bar. As such, it is identified as a +DM.
In the next chart, we have a -DM, since the range portion is below the range of the previous bar.
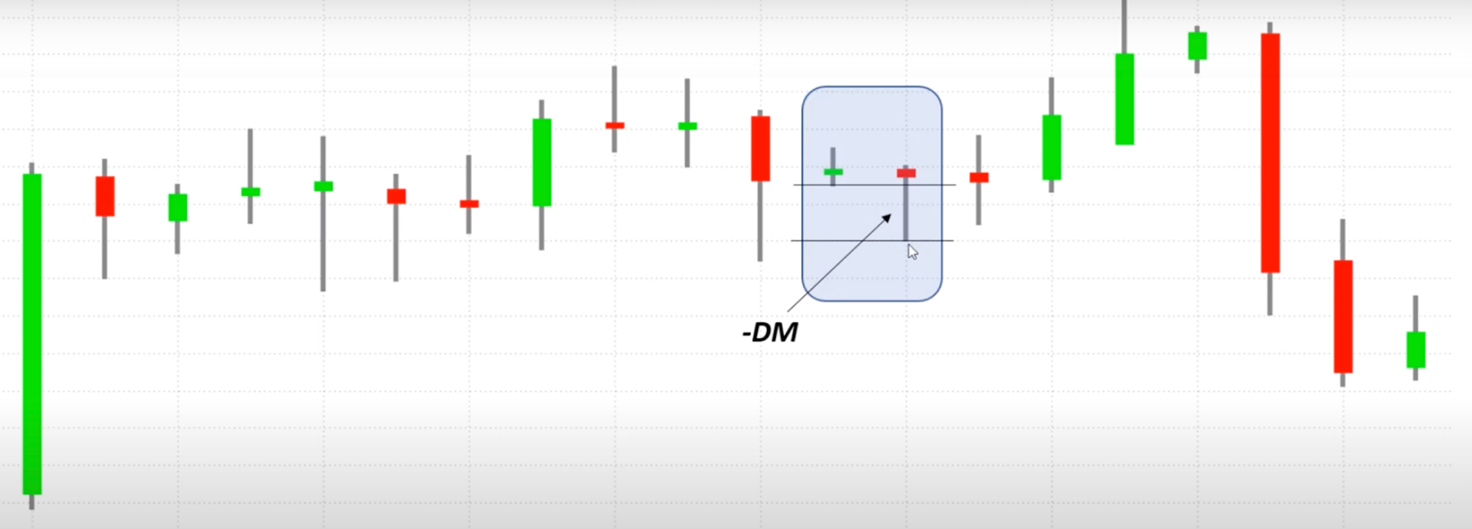
In the case of an inside bar (bar number 3 from the left in the previous chart), we can consider both the Plus and Minus Directional Movement values to be 0.
In the case of an outside bar (bar number 8 from the left in the same chart), Welles recommends considering only the greater portion of the range. In this case, the Plus Directional Movement is greater than the Minus Directional Movement, so for this bar, we will consider only the portion of the range that is above the range of the previous bar.
2. Building the Directional Indicator
After you have identified all the +DM and -DM of the bars you intend to use to calculate the ADX (in the video, we calculate using 7 bars), you can move on to build the Directional Indicator, which is divided into +DI and -DI.
To do this we will use the sum of the two parameters just analyzed (+DM, -DM) and relate them to the sum of the True Ranges of the bars. Watch the video starting at minute 5:45 if you have any questions about this step.
3. Calculating the Directional Movement Index
To perform this step, that is, to build the Directional Movement Index (DX), we need to use the numbers we obtained in the previous step.
Starting at minute 8:00 of the video, you can see the exact formula used to calculate the DX. As you can see, this is not complex at all. Keep in mind that the DX value can only range from 0 to 100, where 0 represents a complete lack of trends and 100 an extremely strong trend.
4. Calculating the ADX indicator
To calculate the Average Directional Index, we need to find the Directional Movement Index of n groups of bars. In the video we use 7 bars to calculate the ADX of our chart. The ADX is simply the average of the Directional Movement Indexes across all the bar groups considered. For clarification, watch the video starting at minute 9:50.
|
|
|
How to Use the ADX Indicator in Systematic Trading – Theory and Practice
Traditionally, an ADX value above 25 indicates a trending market. If the indicator has a value between 20 and 25 the market is neutral, while if the value is below 20, there are no trends present.
Regarding the use of the indicator in a trading system, we usually refer to the strategy that was proposed by Welles, which consists of buying or selling on the crossings of the Directional Indicator. When the Plus Directional Indicator crosses above the Minus Directional Indicator we will to open a long position (we buy).
We will open a short position (we sell) when the Minus Directional Indicator crosses above the Plus Directional Indicator.
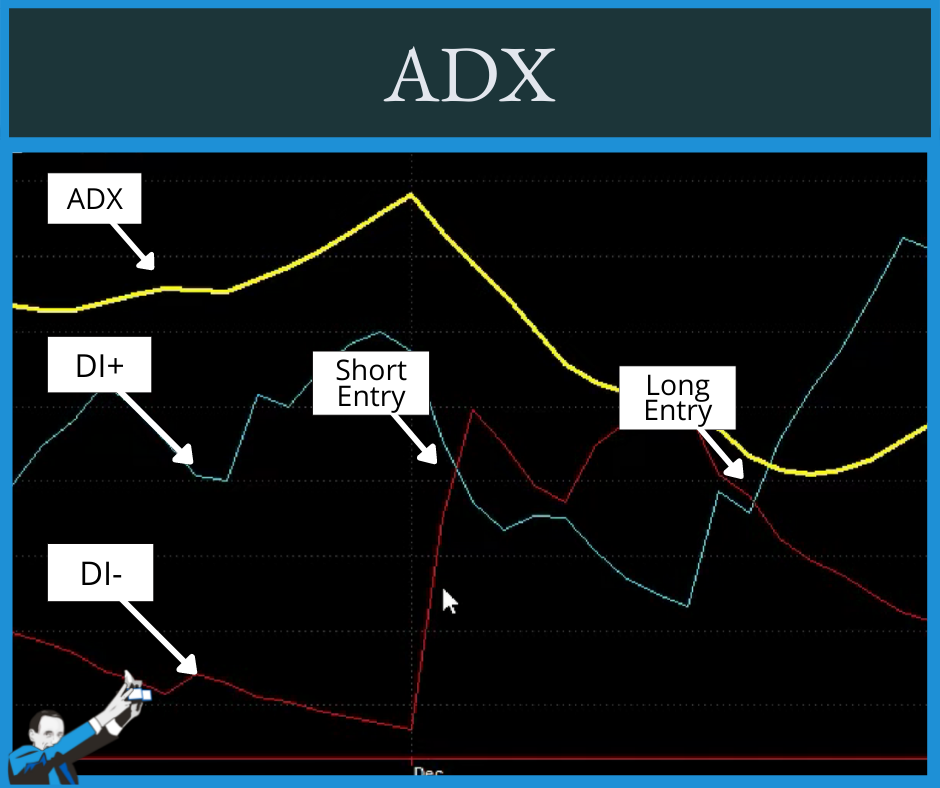
In the video below, our coach shows how to apply this concept to a trading system and tests it on a well-diversified portfolio of instruments, using historical market data from 2010 to the present.
As shown in the video, the system created following Welles’ guidelines is not particularly effective. It is worth noting that this approach was designed over 50 years ago when the markets behaved quite differently.
That is why, in the second part of the video, we perform a new test by adapting the trading system settings to current market conditions. As the equity line shows, there is an improvement in performance, although overall the strategy is still not satisfactory.
Conclusion – An important message
The second video conveys an important message to traders: theory should always be tested before being used in live trading.
As demonstrated, applying the parameters Welles theorized for the ADX over 50 years ago would most likely lead to the creation of an ineffective strategy. The problem is that without running any preliminary tests it would have been impossible to figure it out before going live and risking real losses.
Backtesting thus remains an essential activity to test the validity of our systematic trading strategies.


