Pivot Points are a set of mathematical formulas used to identify certain price levels.
In this article, we will try to understand if they are really effective and what kind of performance we can expect by using them in our strategies.
To do this, we will use two trading systems based on this indicator, one reversal and one trend-following, and we will evaluate their performance through portfolio backtesting.
If you are not familiar with the terms “reversal” and “trend following”, know that reversal refers to a strategy that enters the market “against the trend” (if the market has risen, you sell) while trend following refers to a strategy that enters following the trend (if the market has risen, you buy).
If you want to know more, we recommend reading our articles dedicated to reversal and trend-following strategies.
How to Calculate Pivot Points
As already mentioned, Pivot Points are used to determine the general trend of prices by identifying certain levels.
Let’s see a simple calculation example. The figure below shows daily bars.
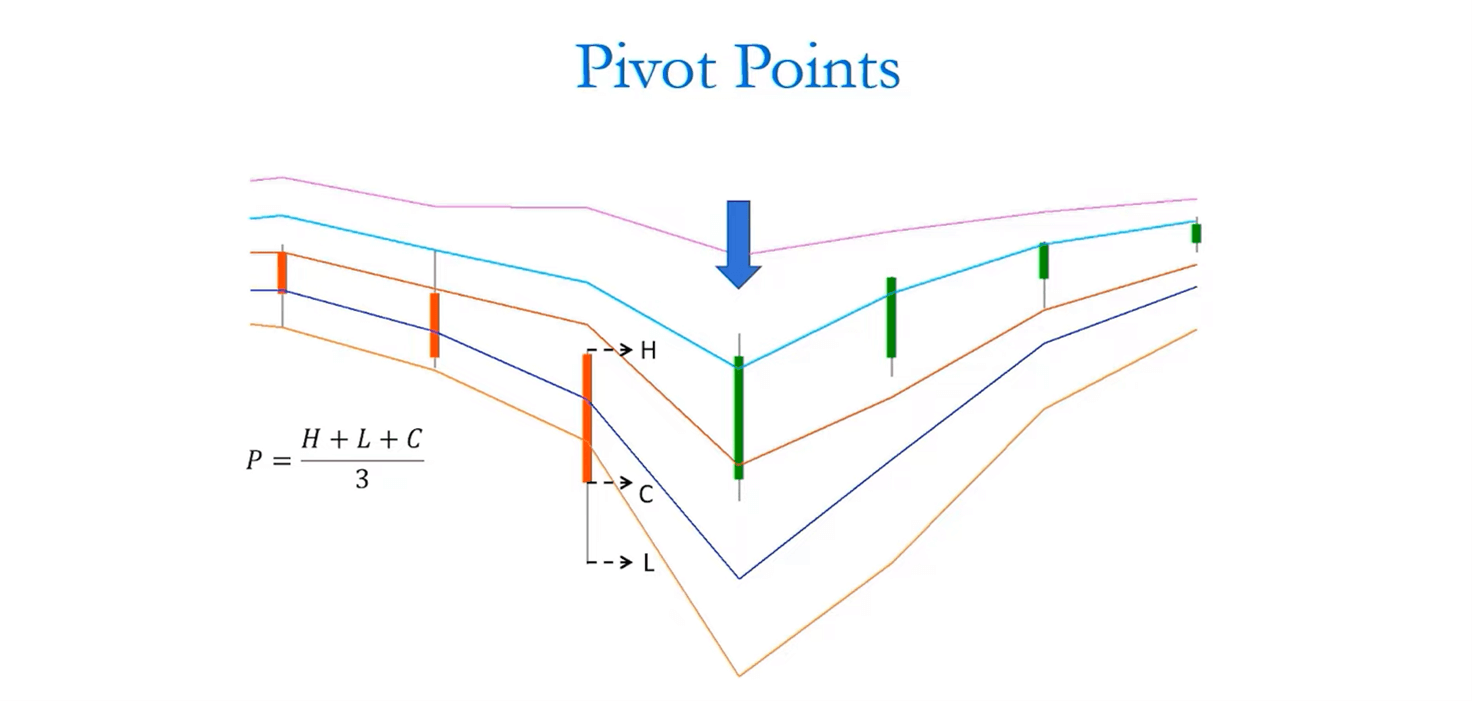
To calculate the Pivot Points of the bar indicated by the blue arrow, you can use the formula written on the left side of the image. As you can see, it is a simple arithmetic average of three bar values (the maximum price, “high“; the minimum price, “low“; the closing price, “close“). These three values refer to the previous bar (orange), as shown by the black arrows.
The arithmetic average is the first value we need to calculate the Pivot Points. To complete the calculation we’ll then need other price levels called “supports and resistances“.
Usually, two pairs of these levels are calculated: S1 and R1, and S2 and R2. The S1 value is obtained by multiplying the Pivot by two and subtracting the previous day’s high, while the R1 level is calculated by multiplying the Pivot by two and subtracting the previous day’s low.
At first glance, it may seem like a complicated calculation, but there is nothing too complicated. Below you will find a video in which one of our coaches explains in detail all the calculation steps, complete with charts and graphs. If you wish, you can skip the introductory part and start watching the video from minute 3:28 where he explains how to calculate the Pivot Points.
Examples of Use
As mentioned at the beginning of this article, Pivot Points are generally used in reversal strategies.
However, there is no rule that prohibits their use in trend–following strategies as well. In our opinion, the best way to understand the real effectiveness of an indicator is to test it with different setups, and that’s exactly what we do in this article.
Reversal Strategy with Pivot Points: Better to Avoid It?
In the video shown above, our coach proposes (starting from minute 7:17) an example of a reversal trading system based on Pivot Points and tests its performance on a well-diversified portfolio containing 15 instruments.
These include energy futures (Crude Oil, Heating Oil, Natural Gas, RBOB Gasoline), currency futures (EuroFX and British Pound), stock index futures (S&P 500 and DAX), bond indexes (Treasury bonds), metal futures (Gold), and other commodities (Wheat).
To perform this portfolio backtest we used Portfolio Trader, a software from the MultiCharts suite that allows you to test a strategy on a very large number of futures without the need for multiple tests.
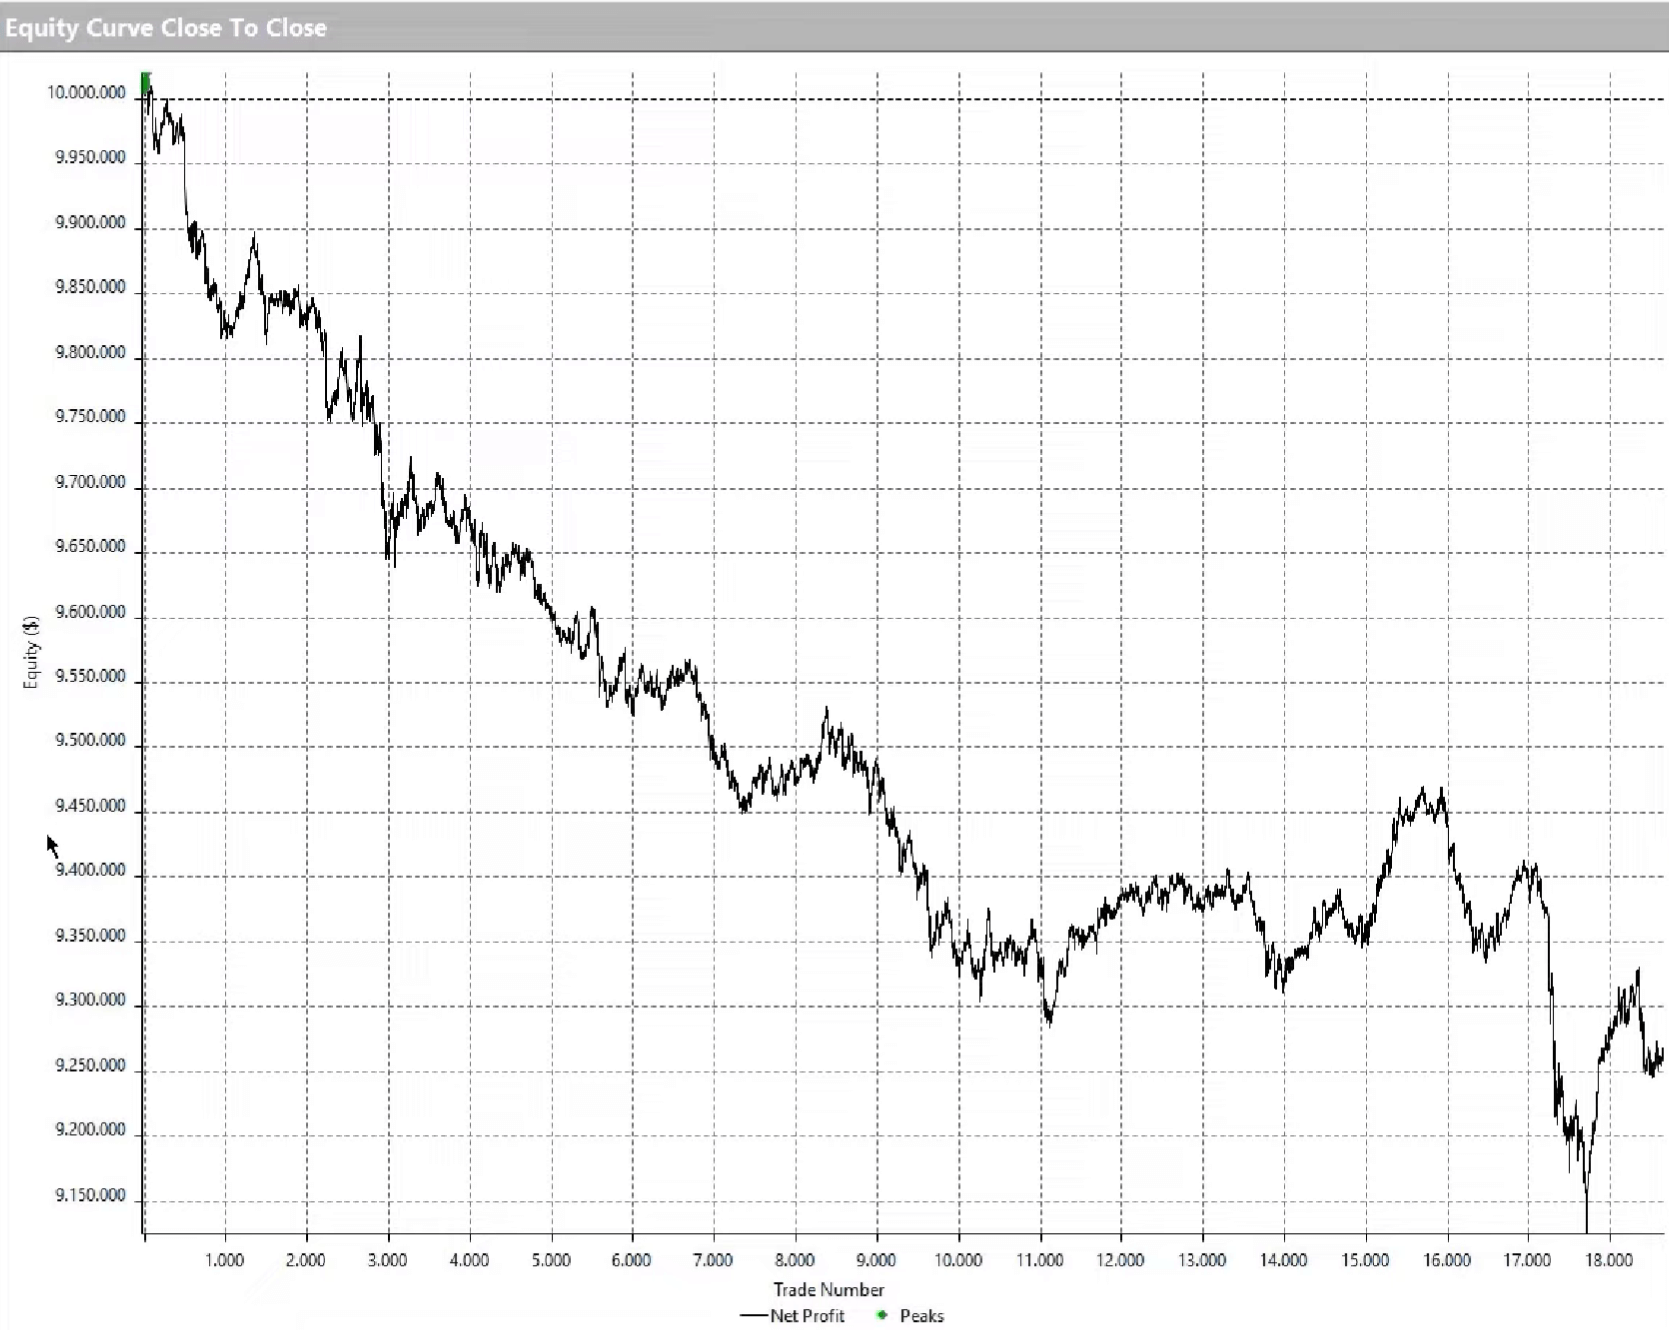
We recommend that you watch the video to better understand how to develop the strategy and grasp its performance. In any case, below we report the equity line of the system which, as you can see, produces results that are nothing short of mortifying.
Trend-Following Strategies with Pivot Points: Is It Worth It?
We observed that using Pivot Points according to the classic approach, that is, in reversal strategies, does not produce very attractive results. But what happens if we use them in a trend-following strategy?
To answer this question, our coach made another video in which he proposes a trend-following strategy based on Pivot Points R1 and S1. Again, you will find detailed explanations on how to develop and test the strategy. We therefore recommend that you take a few minutes to watch the video.
The strategy shown in the video opens long positions (buys) when prices break the R1 resistance upwards and opens short positions (sells) when prices break the S1 support downward. To learn more about how support and resistance levels work, you can read this article.
Below is the equity line produced by the system on the same set of instruments used in the previous test:
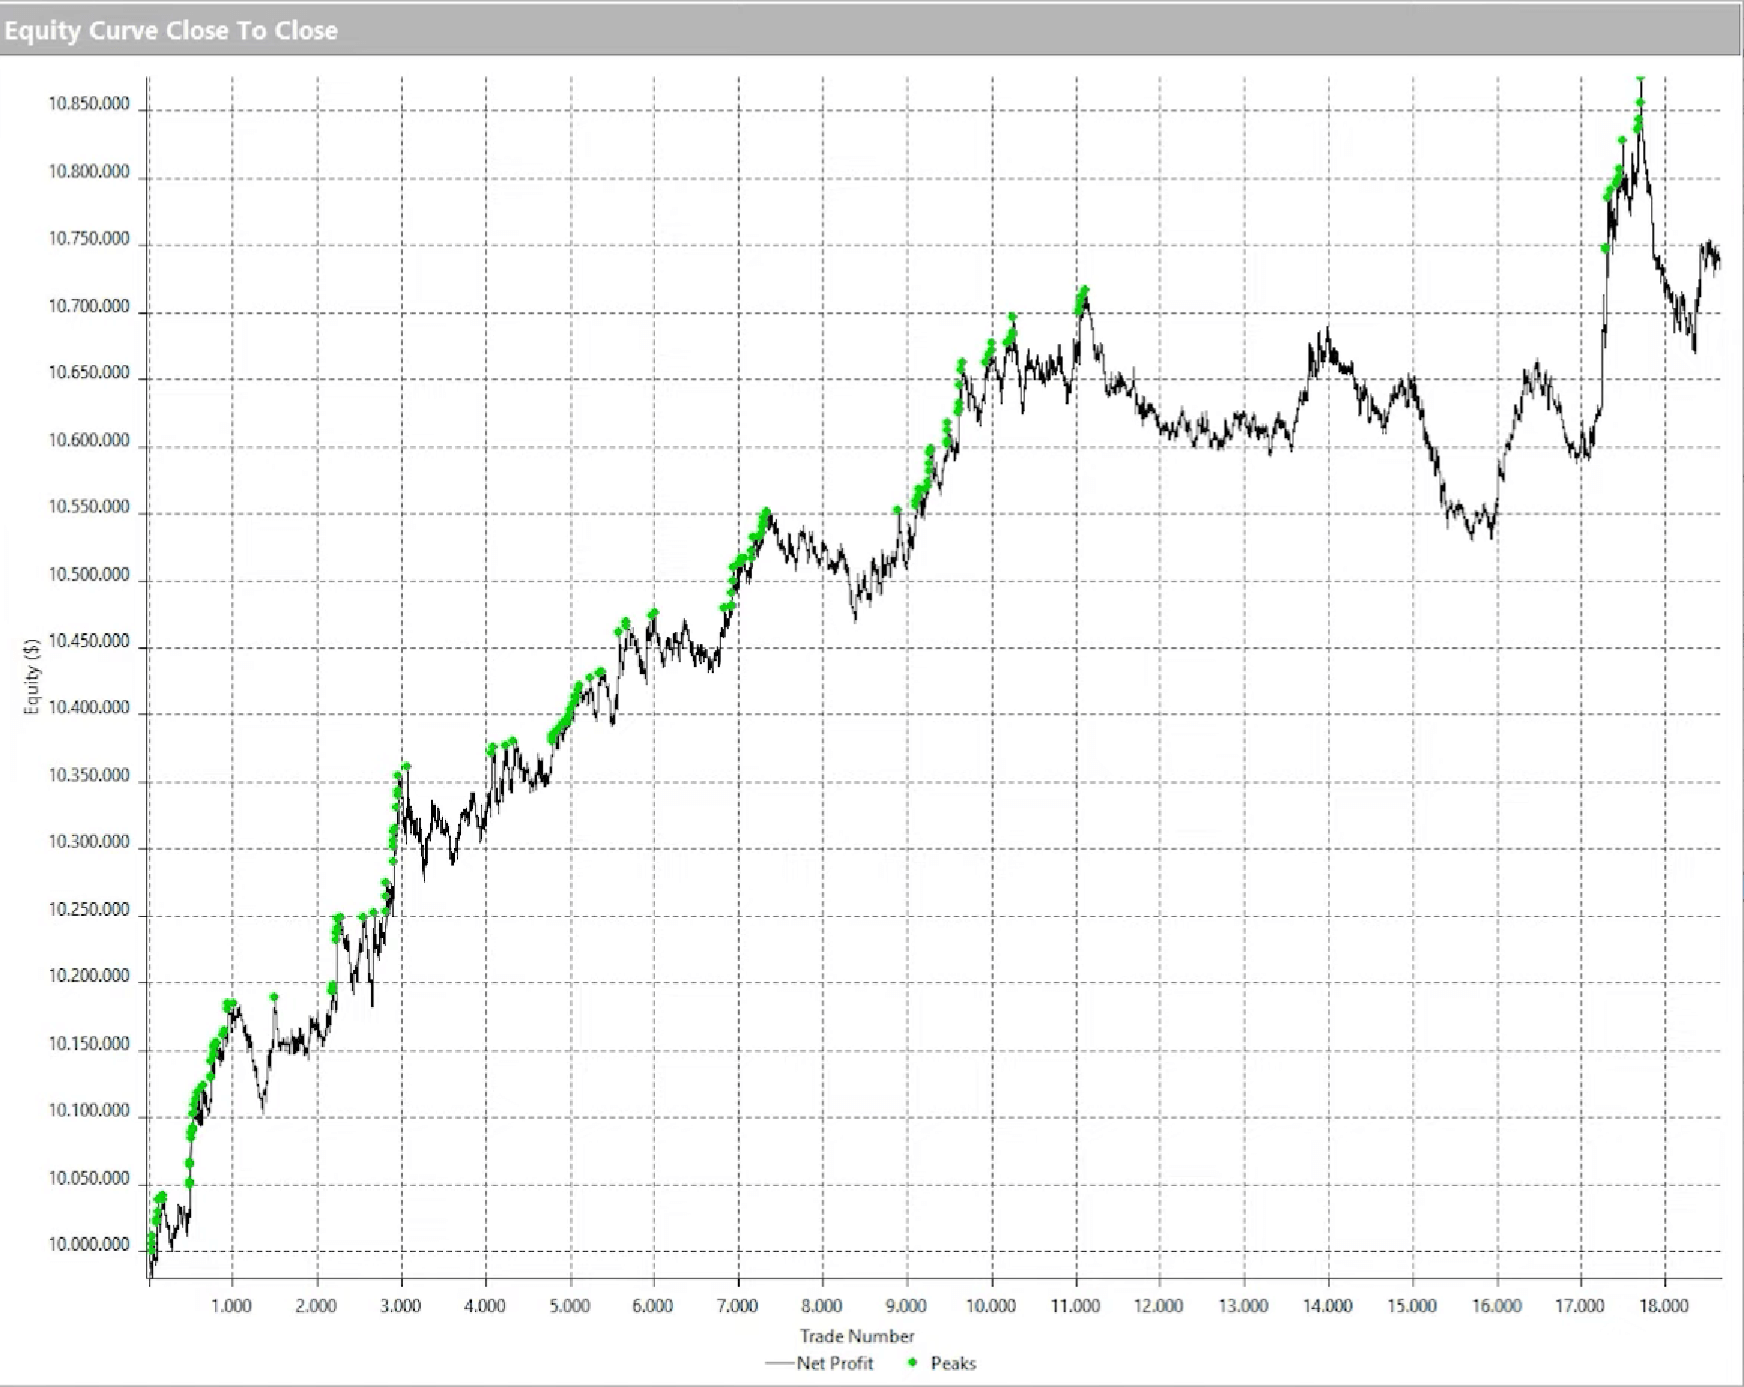
We immediately notice that the equity line improved greatly compared to the previous disastrous situation.
Does this mean that Pivot Points work in trend-following strategies?
In reality, as our coach shows in the rest of the video, this kind of result can also be obtained with a simple trend-following strategy that buys and sells at the breakout of the highs and lows of the previous session.
Conclusion
According to our tests, it seems that the Pivot Points applied to systematic trading are not able to produce attractive results. They perform poorly in reversal strategies, and seem to be a useless complication in trend-following strategies.
We hope that in addition to answering your questions about Pivot Points, this article gave you a fundamental principle: always test your strategies before trading them live, even when they are based on indicators or approaches that are considered universally reliable.
If you are interested in learning more about this, you can read this article where you will find a list of the indicators we use most, together with a series of recommendations for using them correctly.