Financial markets experience constant price fluctuations. The frequency and intensity of these variations determines a market’s volatility and presents interesting investment opportunities.
In this article, we will learn together about volatility and explain how you can exploit it in trading. In addition, we will provide you with insight on how to deal with the most turbulent market situations.
What Is Volatility?
In finance, “volatility” is an indicator that measures the change in the value of an asset or portfolio over a given period of time.
Despite being a very technical term, the concept it expresses is very simple. Over time, the value of a financial instrument can fluctuate due to a myriad of factors (macroeconomic, geopolitical, social, etc.) that affect the supply and demand relationship.
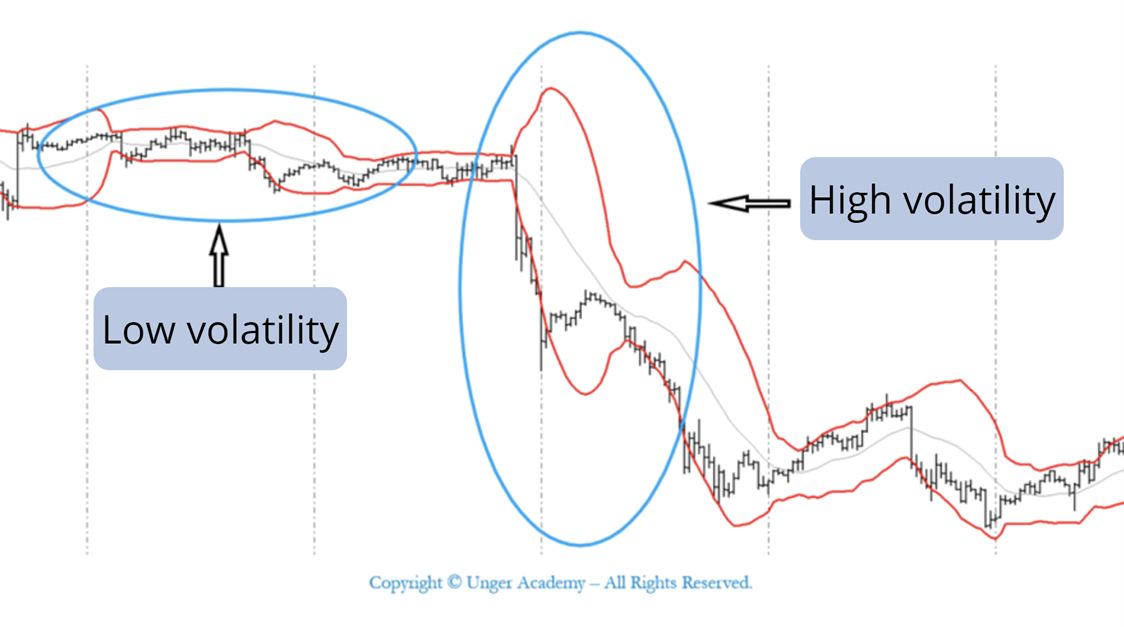
Volatility measures price fluctuations compared to their average value; the greater the amplitude and intensity of the fluctuation, the higher the volatility.
In other words, high volatility indicates that price changes are stronger, while low volatility indicates a more stable and controlled price trend.
To give you an example, imagine flying on an airplane. The regular flight path of the airplane on its route expresses the average value of the price of the financial instrument we are observing, while the fluctuations due to turbulence represents the volatility.
Just like in flight, high volatility in financial markets can create up or down swings which, if not managed well, can be risky.
For this reason, it is essential to know how to deal with volatility correctly in order to make wise investment choices that are in line with one’s own risk profile.
How to Measure Volatility: Deviance and Technical Indicators
From a mathematical perspective, volatility is calculated in percentage points and expresses the distance of the price or rate of return of a financial instrument with respect to its average value over a given period of time.
-
Volatility can be calculated in several ways:
-
Historical volatility: It expresses the historical variation of the prices of a financial instrument with reference to a specific period of time.
-
Implied volatility: It indicates the estimated value of the volatility of an underlying asset.
-
Negative volatility (or downside volatility): It expresses the volatility calculated only on losses.
-
Expected volatility: It indicates what the future volatility of a financial instrument is likely to be and is used to get an idea of the possible risk we could run.
Generally speaking, the greater the fluctuations over the timeframe, the higher the volatility will be. The more stable the fluctuations, the lower the volatility will be.
There are several volatility indicators that allow you to measure the magnitude and speed of fluctuations.
Without going into technicalities, some of the most common indicators are:
-
Standard deviation: It measures the dispersion between the real value and the average value of a financial instrument.
-
VIX (Volatility Index): It measures the historical volatility of the S&P 500 index.
Other widely used technical indicators include the Bollinger Bands and the Average True Range (ATR).
Examples of Volatile Markets
Each market and each asset class has different volatility and, therefore, a different risk/return ratio.
A government bond, for example, is considered a less risky type of investment because the price fluctuations are smaller than in stocks. Consequently, the percentage of volatility is also lower (within 1% per day).
The stock market, on the other hand, has an average daily volatility of 5-15%, but obviously may vary a lot depending on the stock. The volatility values of individual stocks, however, depend heavily on the liquidity of their market sector.
Some markets are more volatile than others. For example, pharmaceuticals and energy are typically more volatile, sometimes reaching 30%.
The same goes for stock indexes. The S&P 500, for example, has daily volatility between 0.5% and 1%, while that of the FTSEMIB ranges from 1% to 3%.
Volatility: Risk or Opportunity?
As we discussed, when volatility is higher, the investment is considered more risky but, potentially, also more profitable.
There is, therefore, a direct relationship between volatility, risk, and return. Typically, to have potentially higher returns you need to be prepared for greater volatility and greater risk.
However, it should be emphasized that while “risk” often has a negative connotation. In finance, however, it simply expresses the uncertainty of an investment and can constitute a danger (if not managed correctly), but also an opportunity if the level of risk is well weighted.
In the following video, we provide you with some trading ideas that can be useful in the development and management of your trading systems during periods of high volatility and backwardation.
More in detail, we explain how to use a volatility filter to overcome the typical problems that mean reverting trading systems can have in case of market crashes. Don’t miss it!
What Are the Best Strategies to Take Advantage of Volatility?
Generally, you can take advantage of daily fluctuations with continuous trading operations on intraday strategies. In view of good money management, however, the ideal solution is to balance these trades with medium-long term strategies.
At this link, you can see in detail different strategies that enable you to exploit moments of high volatility including:
-
Long on stock indexes
-
Naked options
-
Short volatility
Short volatility systems, in particular, are suitable for those who are not volatility experts. These systems are based on different logics (intraday, overnight, breakout etc.) and have an excellent net profit/drawdown ratio.
Conclusions
The performance of financial markets is uncertain by nature. Prices fluctuate continuously due to the changing balance between supply and demand, and this often determines a situation of market fibrillation. Volatility is a fundamental indicator that lets us measure the intensity and speed of these fluctuations.
By itself, volatility is not a negative market characteristic. It simply expresses the degree of uncertainty about the value of a financial instrument. For this reason, volatility can also turn into an opportunity for those who know how to seize it. There are, in fact, intraday strategies capable of fully exploiting the daily volatility.
The key aspect is knowing how to manage the risk associated with volatility by building a well-balanced and diversified portfolio of strategies that trade on decorrelated assets. Only in this way will you succeed in avoiding overexposure and protecting your capital.