What is the MACD Indicator (Moving Average Convergence Divergence)
MACD stands for “Moving Average Convergence Divergence.” It is widely used in technical analysis and, like all indicators, is a reworking of the prices we find in the chart.
The MACD is a qualitative indicator that helps us determine the direction, strength, and duration of a trend. For this reason, it can help when we want to filter out market noise and, consequently, reduce the risk of opening positions in the wrong direction.
In systematic trading, this indicator can be easily coded within trading systems and used to generate entry and exit signals. Regarding the timeframe to be used in the systems, note that although the MACD was originally intended for use on daily bars, it can also be used on intraday bars.
In this article, we will explain what the MACD indicator is and how to calculate it, what kind of trading signals it can provide, how to build and improve automated strategies based on it.
How to Calculate the MACD Indicator
Basically, the MACD is a line drawn on the price chart that lets you know in what direction and how strongly a particular instrument is moving.
To get useable entry and exit signals for your strategies, you generally need to calculate another line, called the “Signal line.”
The inputs needed to calculate the MACD and the Signal Line are contained in the market data of the instrument. Usually, they correspond to the closing values of the bars you are considering.
To calculate the MACD, you simply need to find the difference between two exponential moving averages, a 26-period slow one and a 12-period fast one.
For example, you can calculate the MACD by finding the difference between the exponential moving average of the closes of the last 26 bars and the exponential moving average of the closes of the last 12 bars.
As for the Signal Line, that is, the line needed to generate the trading signals, you simply need to calculate the 9-period exponential moving average of the MACD (thus using the values of the last 9 bars of the MACD).
Interestingly, in the exponential moving average, the weights of the bars used for calculation are NOT all equal to each other. In fact, the closes of the newer bars have greater weight than those of the older bars.
This detail might seem irrelevant. However, it is very useful to get a clearer picture of how the MACD works. Thanks to the greater weight given to the most recent bars, the MACD can react to market movements more promptly, helping to assess the momentum and direction of current trends.
Trading Signals Provided by the MACD Indicator
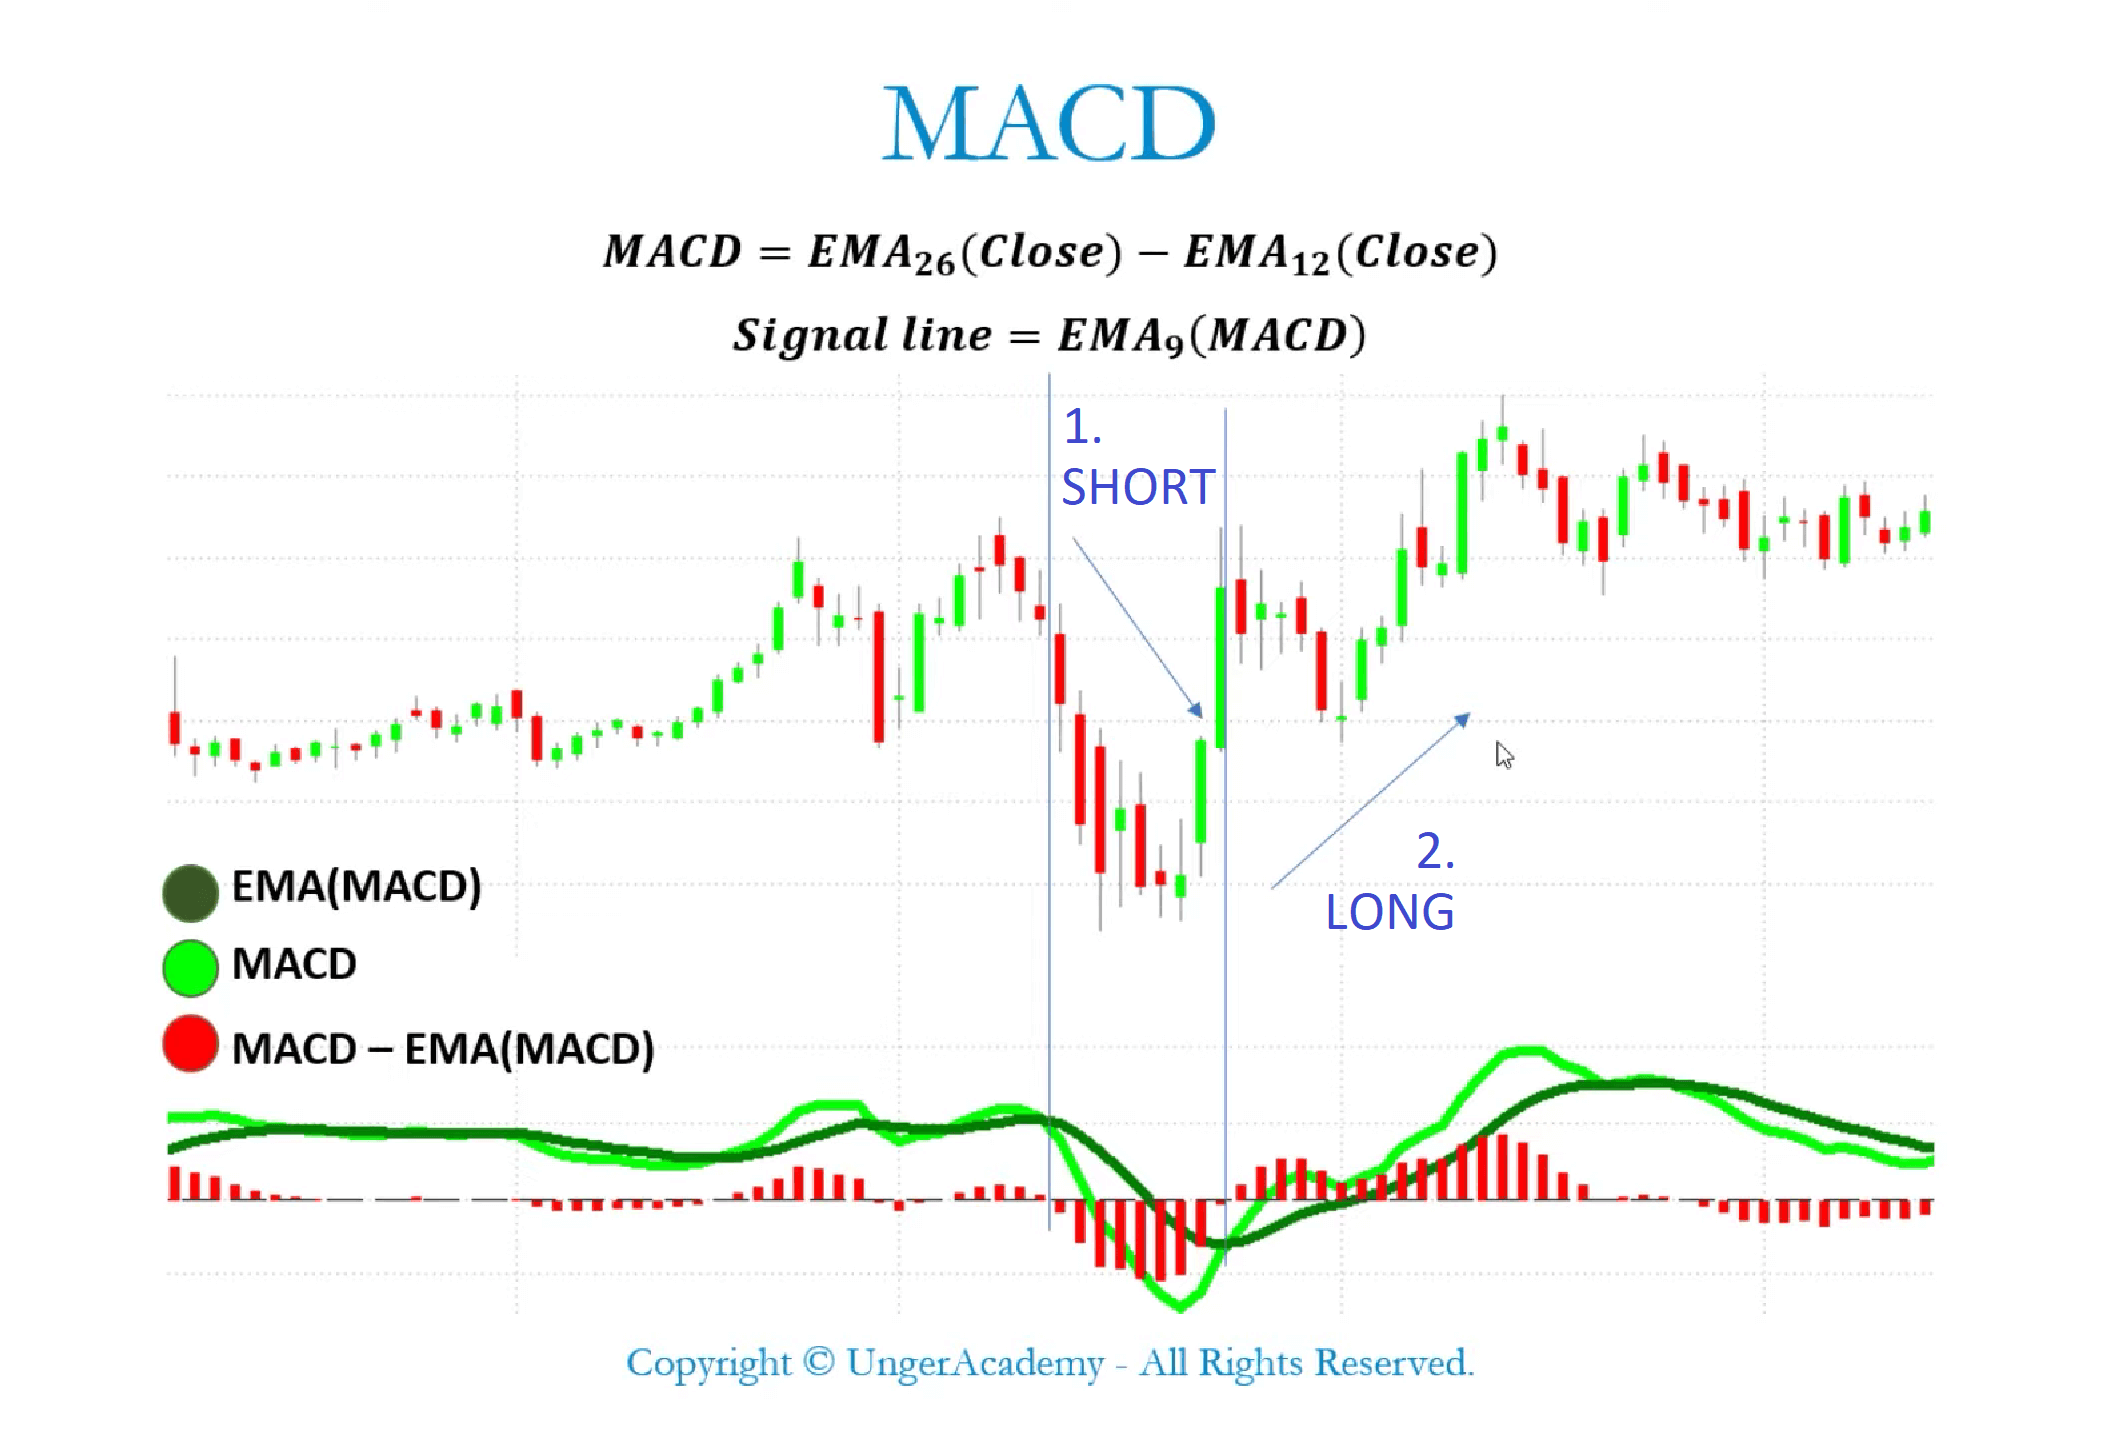
Below you can see an example of the MACD indicator applied to a chart.

At the top are the price bars, while at the bottom of the chart we see two lines and a histogram. The light green line represents the MACD while the dark green line plots the Signal Line.
In contrast, the bars in the histogram below represent the difference between the MACD and the Signal Line and let us easily assess when convergence or divergence occurs between these two lines.
As you can see, the histogram bars get longer when the two lines are farther apart and shorter when they are closer, until they cancel out in the case of a crossing or convergence.
Below you can find some methods for getting signals using the MACD and the Signal Line.
Crossing between the MACD and the Signal Line
One of the most popular methods for using the MACD in trading strategies is to analyze its convergences with the Signal Line.
When the MACD line crosses above the Signal Line we get a long entry signal. On the other hand, when the MACD line crosses below the Signal Line, we get a short entry signal.
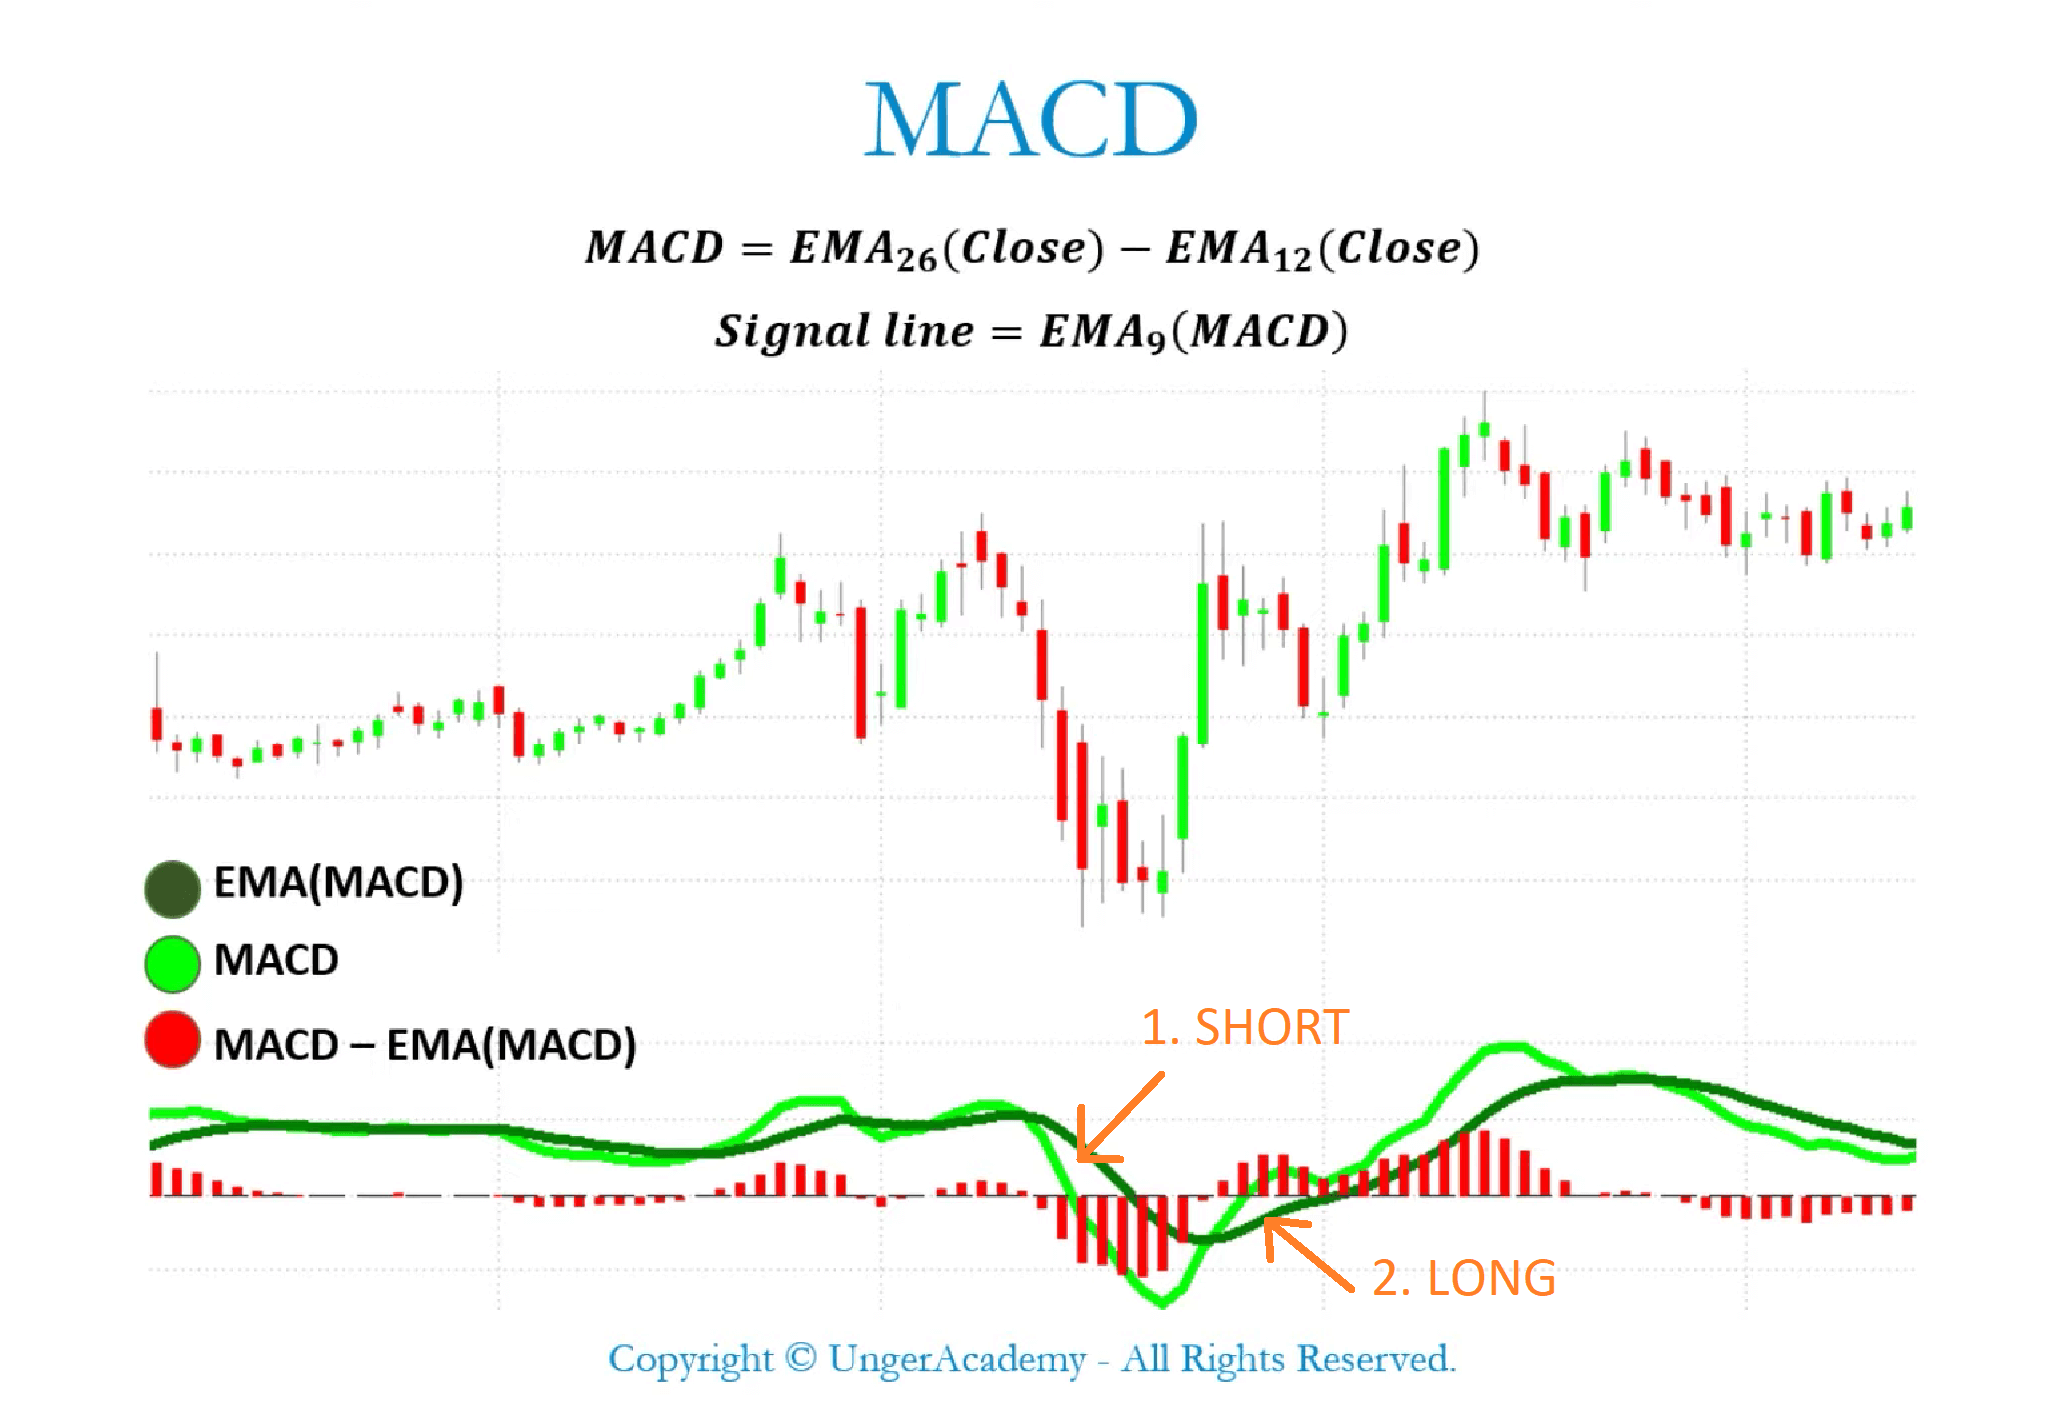
In the image below you can see two examples of crosses between the MACD and the Signal Line.
In the first example starting from the left, the MACD line (light green) crosses below the Signal Line (dark green), so we have a short entry signal. In the second example, the MACD line crosses above the Signal Line, generating a long entry signal.
Crossings with the Zero Line
If we want to use the MACD line by itself, without the Signal Line, we can get trading signals by evaluating its position compared to the zero line (this is the horizontal line from which the bars of the histogram depart).
As shown in the figure below, when the MACD line crosses the zero line downward we get a short entry signal because it means that the market is moving downward.
Instead, when the MACD line crosses the zero line upward we get a long entry signal because the market is moving upward.
In this video, you can find a detailed explanation of how the MACD indicator works, complete with charts, formulas, and calculation examples.
How to Build Trading Systems Based on the MACD Indicator
The MACD indicator can provide important information about current market trends whicH we can use as entry and exit signals for our strategies.
Using this indicator in a trading system is not difficult at all.
In fact, to calculate the MACD we can simply use the pre-built function provided in the library of our trading platform. Generally, this function is simply called “MACD”.
The inputs required by this function are: bar closes, a number of periods for calculating the fast exponential moving average (by default this value is 12), and a number of periods for calculating the slow exponential moving average (by default this value is 26).
To calculate the Signal Line, that is, the line that allows us to get the trading signals, we need to calculate the exponential moving average of the MACD over 9 periods.
An example of a strategy based on the MACD and its crosses with the Signal Line to determine market entries might involve opening long positions when the MACD crosses above the Signal Line and short positions when the MACD crosses below the Signal Line.
In the following video, we show you how to develop and optimize this simple trading system based on the MACD indicator.
We go into detail about the inputs, functions, and conditions to be included in the system script and test such a system on a portfolio of 15 instruments using a time frame of 1440 minutes.
How to Improve the Performance of a Strategy Using the MACD Indicator
As explained in the video above, using signals generated by crossings between the MACD and its 9-period exponential moving average may not be enough for optimal performance.
For this reason, in the video, we show several adjustments that can be made to produce a marked improvement in strategy performance, reducing the drawdown, increasing the average trade, and improving the shape of the equity curve.
1. Add a stop loss and a take profit
Among these adjustments, we find position management mechanisms such as stop loss and take profit. To set these levels, you need to select values that are in line with the average monetary range of the instrument on which you are trading.
2. Using the MACD indicator to filter the entries
Another way to improve the performance of trading systems based on the MACD is to use this indicator as a filter for market entries.
For example, one can filter short entries so that they occur only when the fast exponential moving average is below the slow exponential moving average. This way, the system will open the short trades only when the MACD is negative and the long trades only when the MACD is positive.
3. Using MACD divergences/convergences to filter the exits
The MACD indicator can also be used to filter out exits from positions. In this case, you can exploit the convergence or divergence between the MACD and the Signal Line (as previously explained, this is represented by the histogram).
After crossing with each other, the MACD line and the Signal Line tend to diverge and then converge again later. When these lines converge again, an order can be sent to close the position, since this behavior could indicate a reversal of the market trend.
4. Optimization of the number of periods used for calculating the averages
Another way to improve the performance of a MACD strategy is to optimize the inputs used to calculate the exponential moving averages, i.e., 9, 12, and 26, looking for values that can produce better results than the default ones.
Conclusion
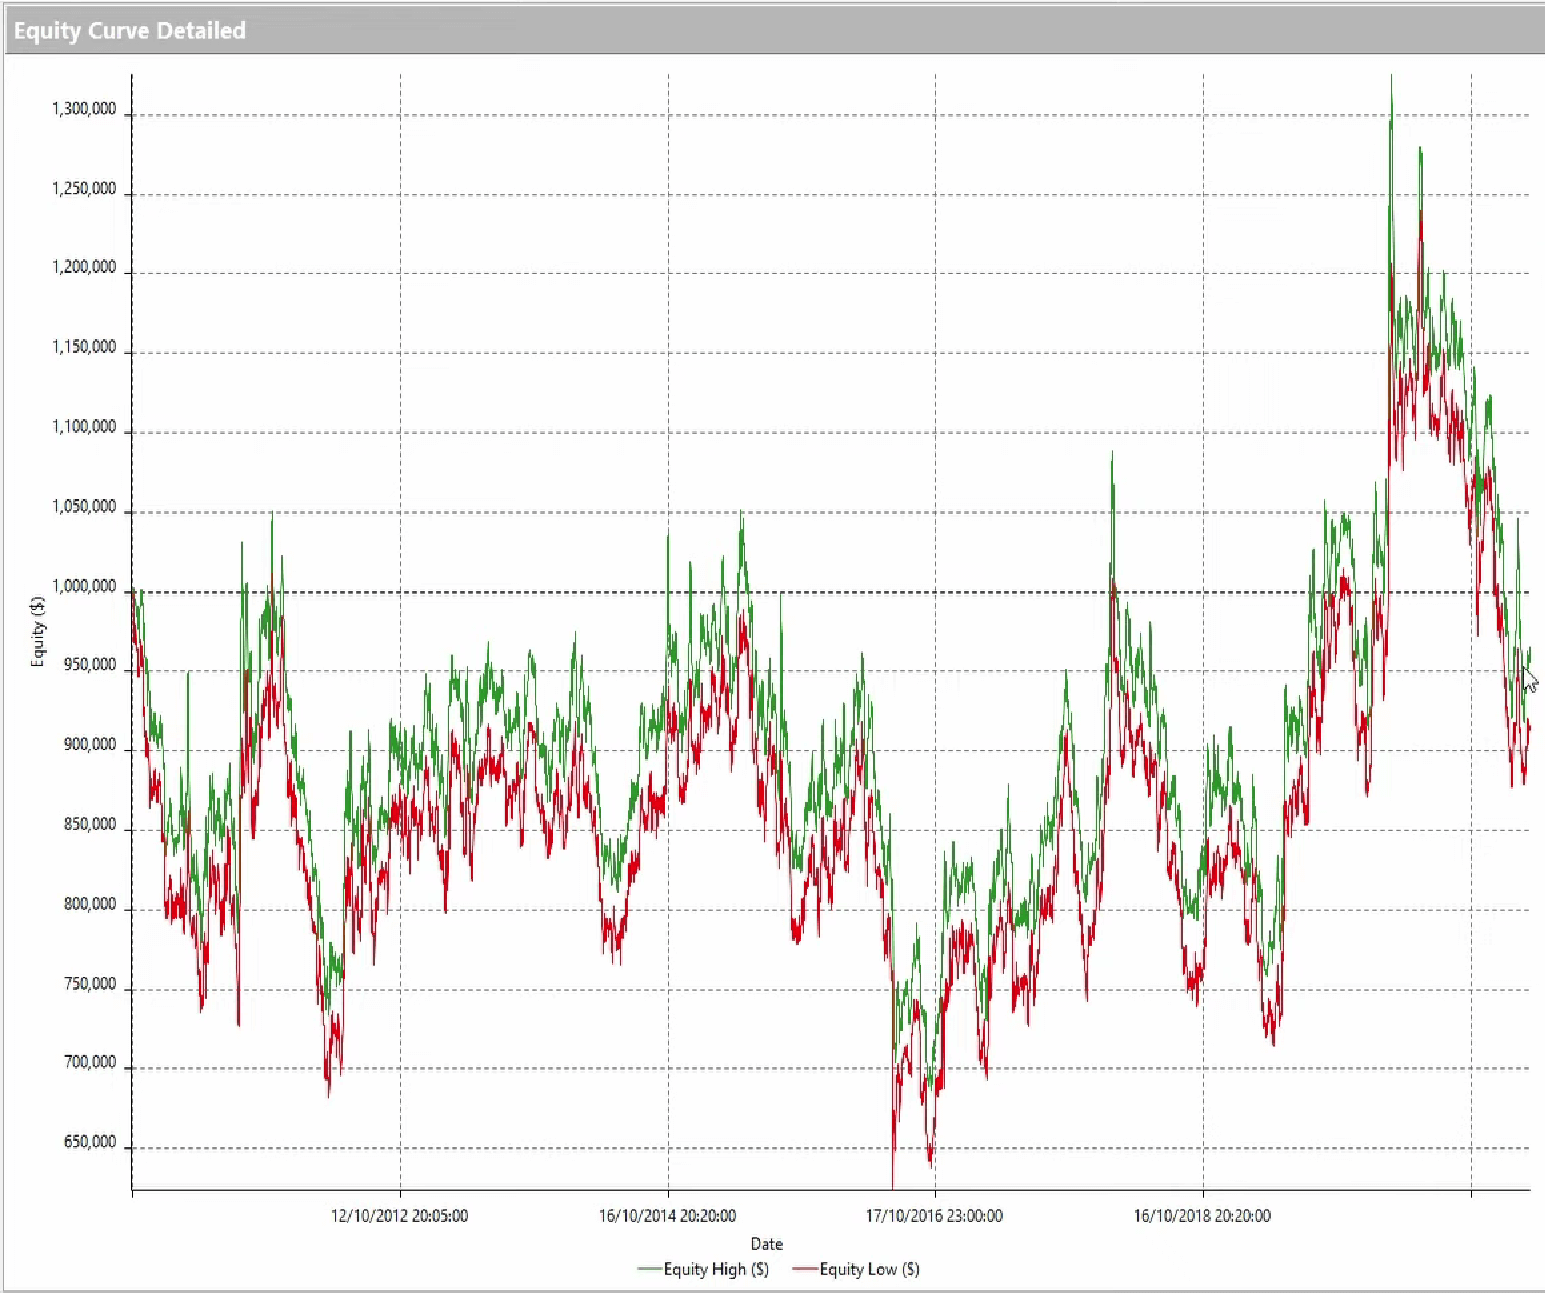
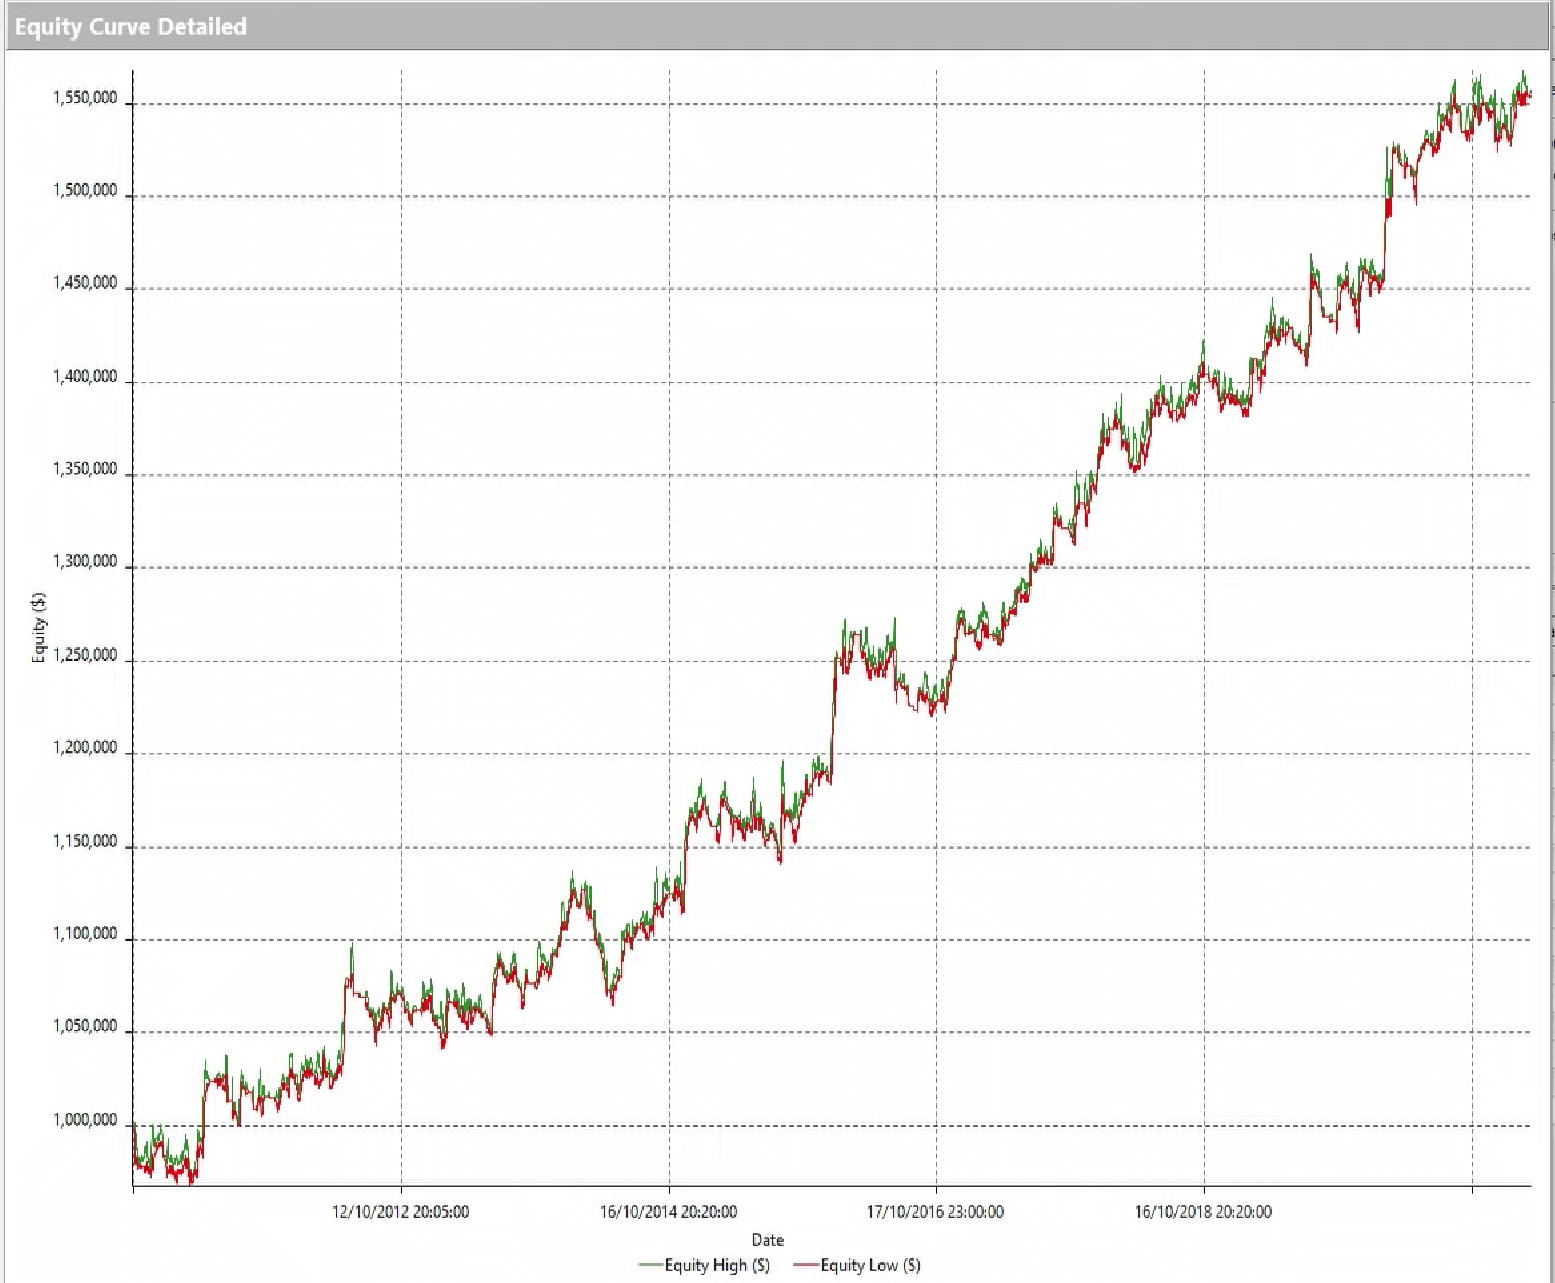
The adjustments shown in the video and mentioned in this article can prove extremely useful in increasing the average trade, reducing the drawdown, and dramatically improving equity line performance.
We conclude with a comparison of the equity line of the basic system and that of the system after incorporating some of the adjustments listed above:
|
|
|