What is a Pin Bar, and why can they be useful for you in trading? In this guide, you will learn what Pin Bars are and how these trading signals work, and we will explain how you can use them to build effective trading strategies. Also, we will show you the performance of one of our Forex trading systems that is precisely based on Pin Bars.
What Is a Pin Bar
The “Pin Bar, a contraction of “Pinocchio’s bar,” is a candle-shaped graphical representation whose name is derived from its long segment, also called “nose” or “shadow,” reminiscent of Pinocchio’s nose.
Graphically, such a segment moves in the opposite direction of the asset’s potential new price direction. Thus, a “price action signal” indicates an impending trend reversal.
If interpreted and used correctly, such a signal can provide interesting trrading insights, which is why learning how to recognize and use it properly can be pretty interesting.
Main Features of the Pin Bar
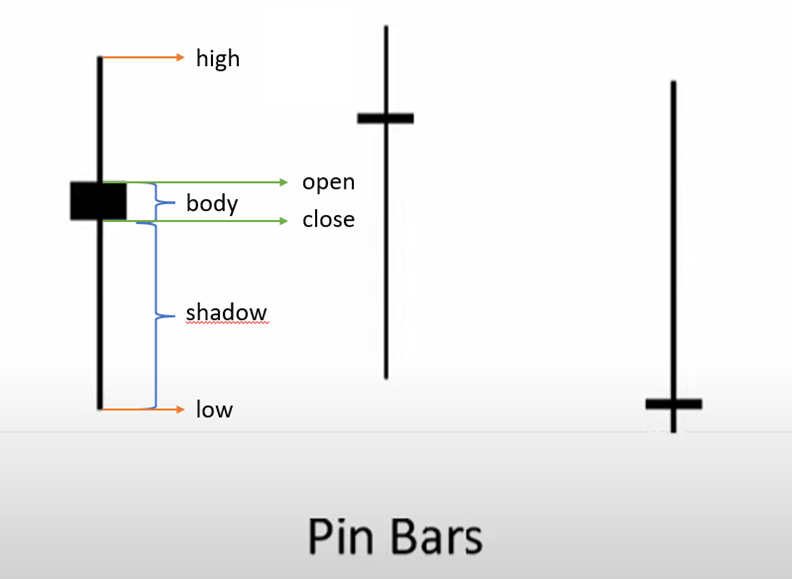
From a graphical standpoint, Pin Bars consist of two main parts:
-
A long segment called a “nose,” “tail,” or “shadow” that extends in the opposite direction of the potential new trend;
-
A tiny “body” in relation to the “range,” which is the total length of the bar. The body’s width is determined by the opening and closing prices, which are very close to each other, almost at the same level, in a real pin bar.
In general, only candlesticks with a shadow of at least 2/3 of the total length of the bar should be considered to obtain a valid trading indication.
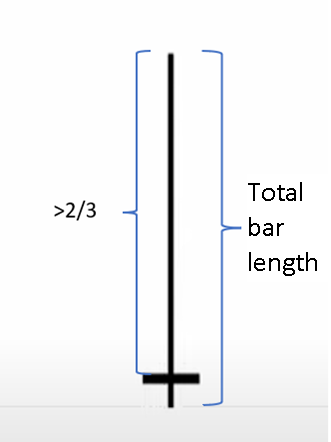
The greater the length of the shadow, the stronger and more effective the reversal signal.
Not only that. Before making a decision, one should always observe the context in which the Pin Bar develops.
In particular, the position of the Pin Bar in relation to the previous bar should be studied, and one should wait for the formation of the following bar.
Indeed, depending on the positioning of the Pin Bar’s nose in relation to its body and the adjacent candlesticks, we can have bearish or bullish Pin Bars.
Bullish Pin Bar
A bullish Pin Bar is characterized by the following:
-
Long shadow or nose on the underside
-
The shadow must touch or cross a support
-
The body of the Pin Bar must be within the high/low range of the previous bar, or better yet, within the body of the previous bar
-
The low of the Pin Bar must cross the previous lows.
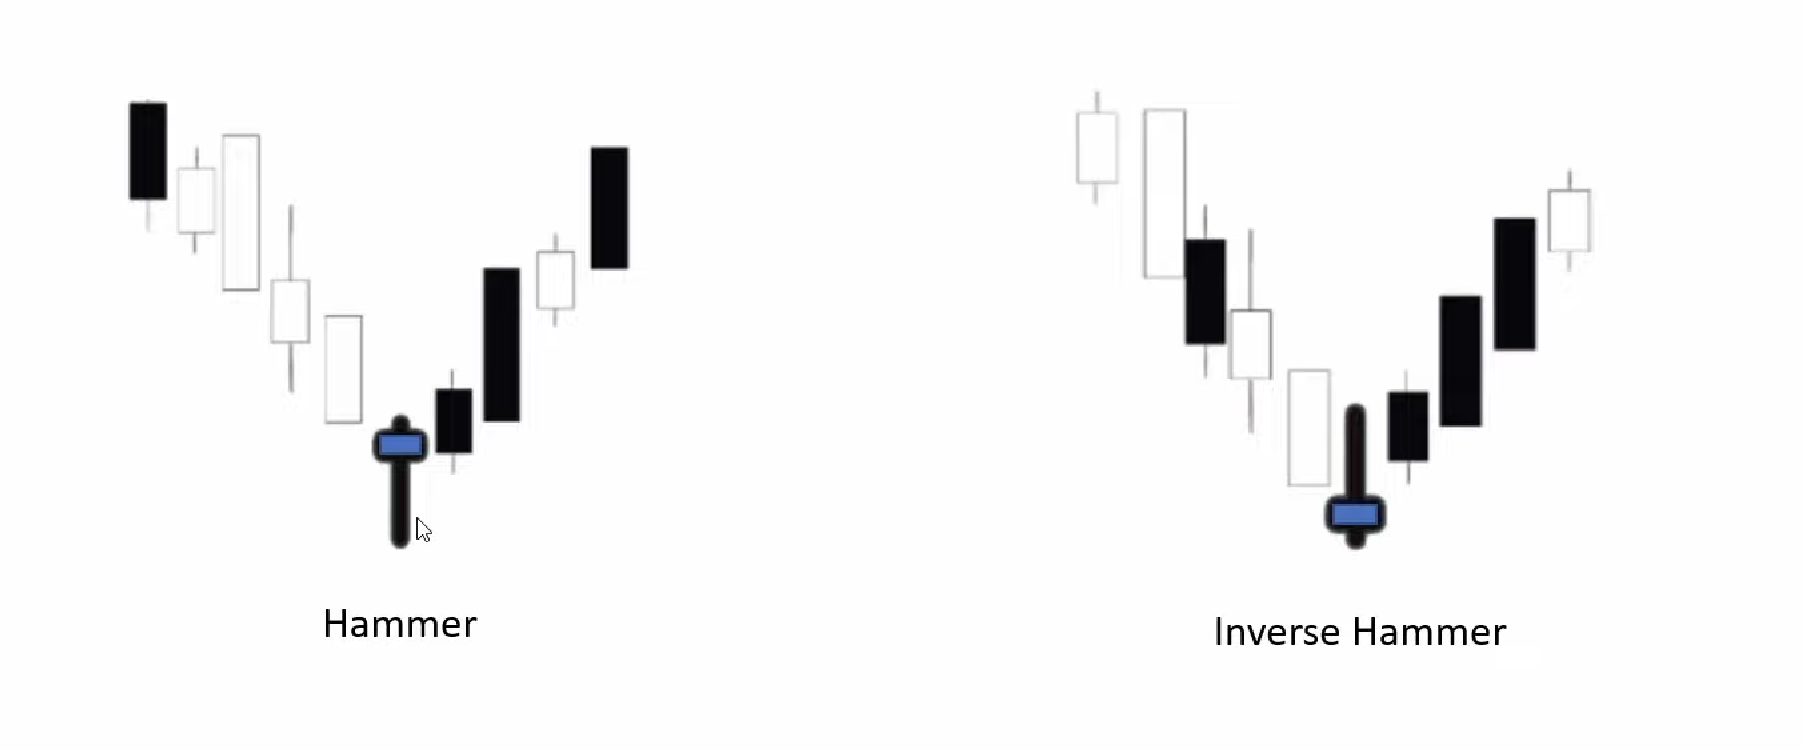
The main bullish patterns are the “hammer” and the “inverse hammer“: both mark the end of a downtrend and the beginning of an uptrend.
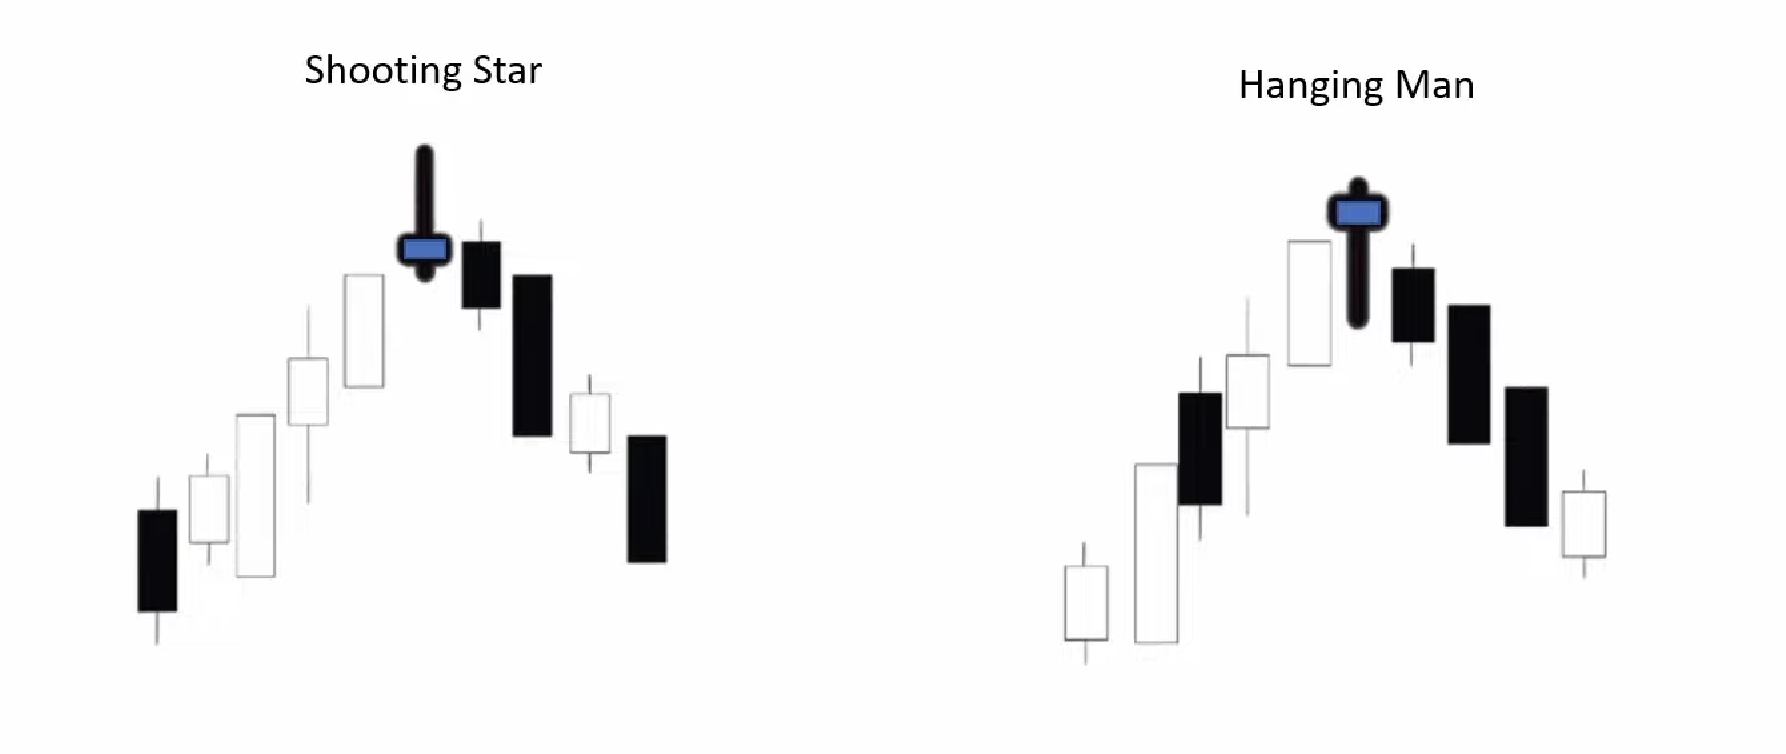
Bearish Pin Bar
The main features of a Bearish Pin Bar are:
-
Long shadow or nose on the upside
-
The upper shadow must touch or cross a resistance
-
The body of the Pin Bar must fall within the high/low range of the previous bar or, better yet, within the body of the bar
-
The high of the Pin Bar must cross the previous highs
The most commonly used bearish patterns are the “shooting star” and the “hanging man” These are the mirror patterns of the hammer and inverse hammer.
In this case, the Pin Bar marks the end of an uptrend and the beginning of a downtrend.
If you want to learn more about price patterns, you can read this article: Guide to Patterns in Trading – How to Recognize Patterns and Exploit Them in Your Trading Systems
Application in Systematic Trading
But let’s get to the heart of the question: is it possible to gain an advantage by using these bullish/bearish patterns?
In the following video, one of our coaches explains how to create a Forex strategy based precisely on Pin Bar patterns and tests their potential on individual markets as well as in a portfolio:
Conclusions
Pin bars are price action signals used to detect trend reversals in the prices of an underlying asset.
Unfortunately, as shown in the video, their application in systematic trading is not very promising.
Our tests, both on individual markets and in portfolios, suggest that these price configurations are better suited for chart analysis than for systematic trading, as they don’t seem to detect market entry points effectively enough.