Morning star, engulfing, head and shoulders: what do these somewhat fanciful names refer to?
They are all different price patterns, which are particular graphical configurations of financial asset prices. These patterns can be used to forecast how prices will behave in the future.
In this article, we’ll explore patterns in detail, especially some of the most well-known and widely used patterns. We’ll also consider which patterns are the most effective to use in our trading systems.
What Are Patterns?
As previously mentioned, price patterns are particular chart configurations that occur repeatedly throughout the history of financial instruments. These configurations can be detected in both candlestick and traditional bar charts.
Patterns are a tool of technical analysis, but they can also be successfully used in systematic trading.
The big difference between these two approaches is that systematic trading offers the ability to decide upstream which parameters to observe and which trades to automate.
The program is automated and requires no direct intervention. Not only that, but with systematic trading, we can also test pattern-based strategies and verify their effectiveness before live trading .
Using patterns within a platform for systematic trading usually doesn’t introduce particular difficulties, in part because the most well-known patterns are often already encoded in the libraries of these platforms.
Once the trading system is coded, all you must do is apply it to the instrument on which you want to trade, specify the timeframe, and the trading system will send the buy or sell order as soon as the pattern appears.
The Most Commonly Used Price Patterns
There are indeed many existing patterns. This article will look at a handful of the most common ones.
However, before we begin, it’s important to briefly review some basic concepts that will serve to better your understanding of the behavior of patterns.
First, you need to know that patterns are often broken down by trends, which can be bullish, bearish, or continuations. When we talk about a trend (or tendency) in trading, we refer to the direction in which a market moves in a sustained manner over time.
A bullish trend describes an upward price movement over a given time frame. A bearish trend is, on the contrary, a sustained downward movement over time. Finally, a sideways trend when there is neither a downward nor an upward trend.
Supports and resistances often come up with trends. These terms refer to the levels at which a price stops its ascent (or descent) and continues in the opposite direction.
Supports are the levels at which a price falls before it begins to rise. Resistances are the upper levels where a price stops its ascent and begins to fall.
If you’re in doubt about any of the terms or concepts you’ll encounter while describing the different patterns, please refer to our guide on the most used terms in trading.
Now let’s explore some specific patterns.
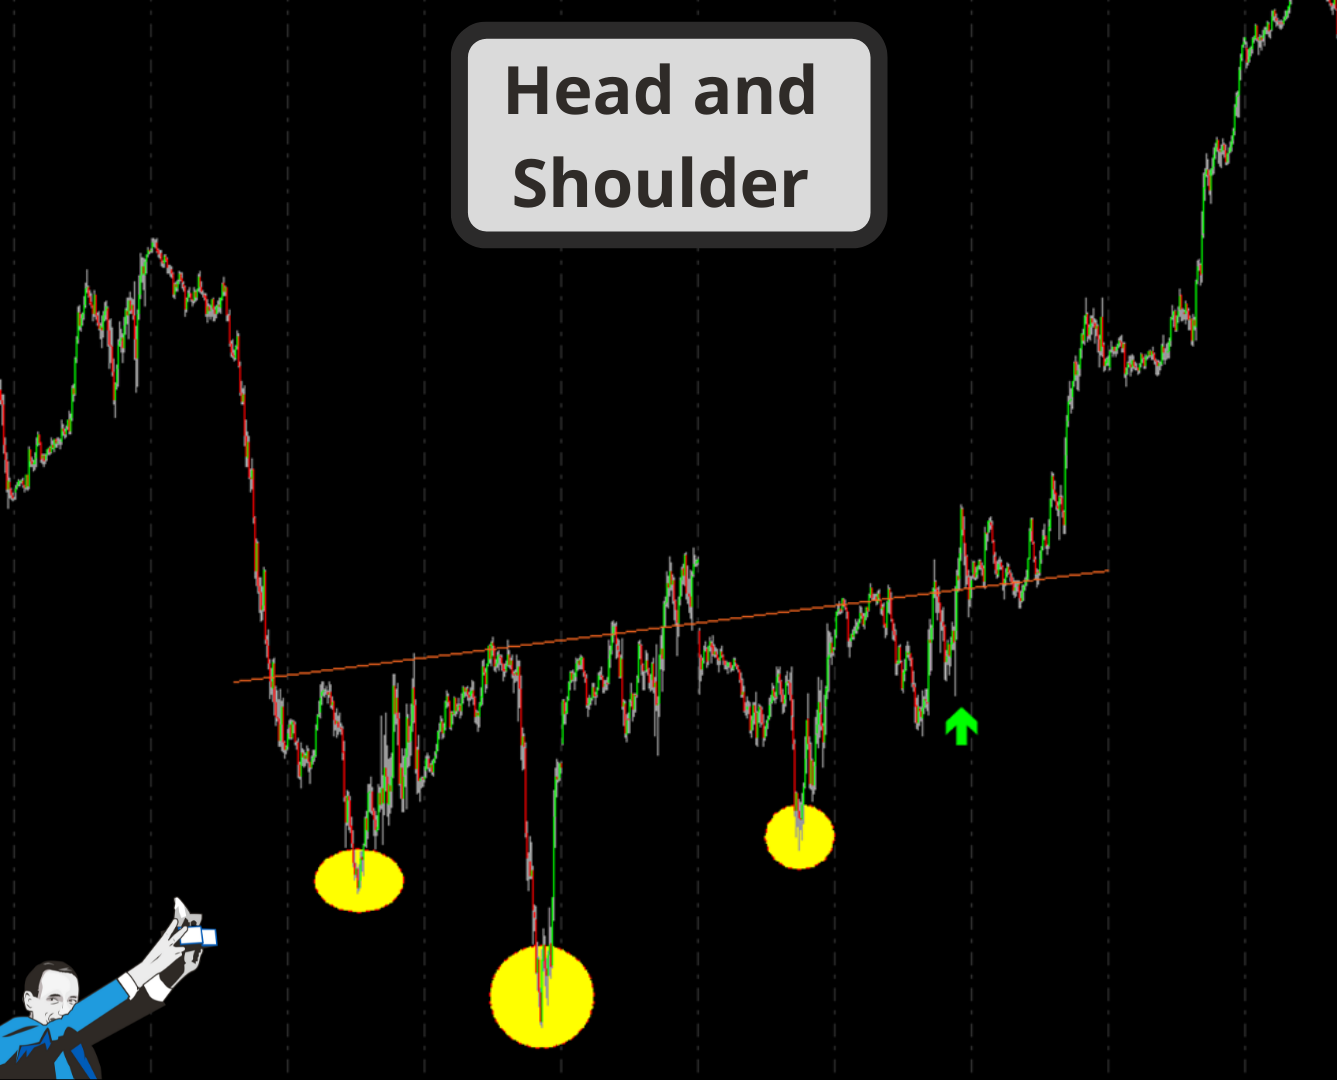
Head and Shoulder
Head and Shoulder is a chart pattern in which a large peak has a slightly smaller peak on either side. We can exploit the head and shoulder patterns to detect reversals.
Although the first and third peaks are smaller than the second, all three drop to the same level of support or resistance, also known as the “neckline” (orange line in the picture). Once a price breaks the neckline, the trend is likely to reverse its course.
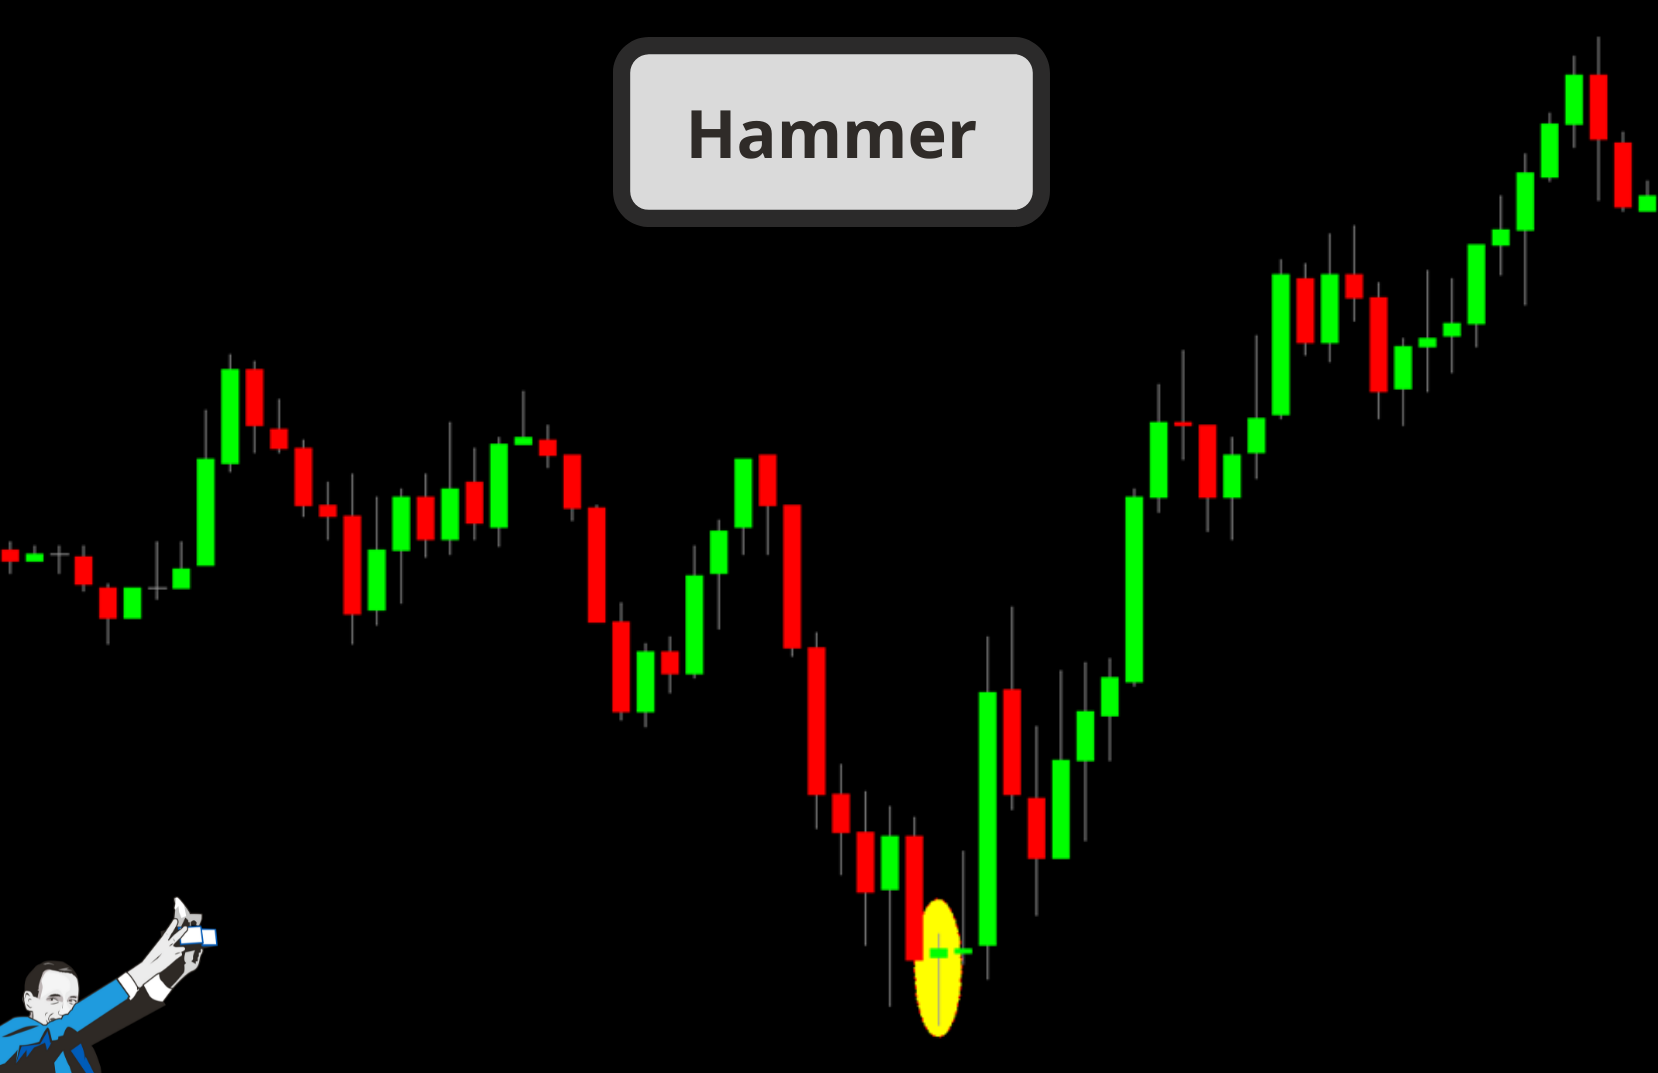
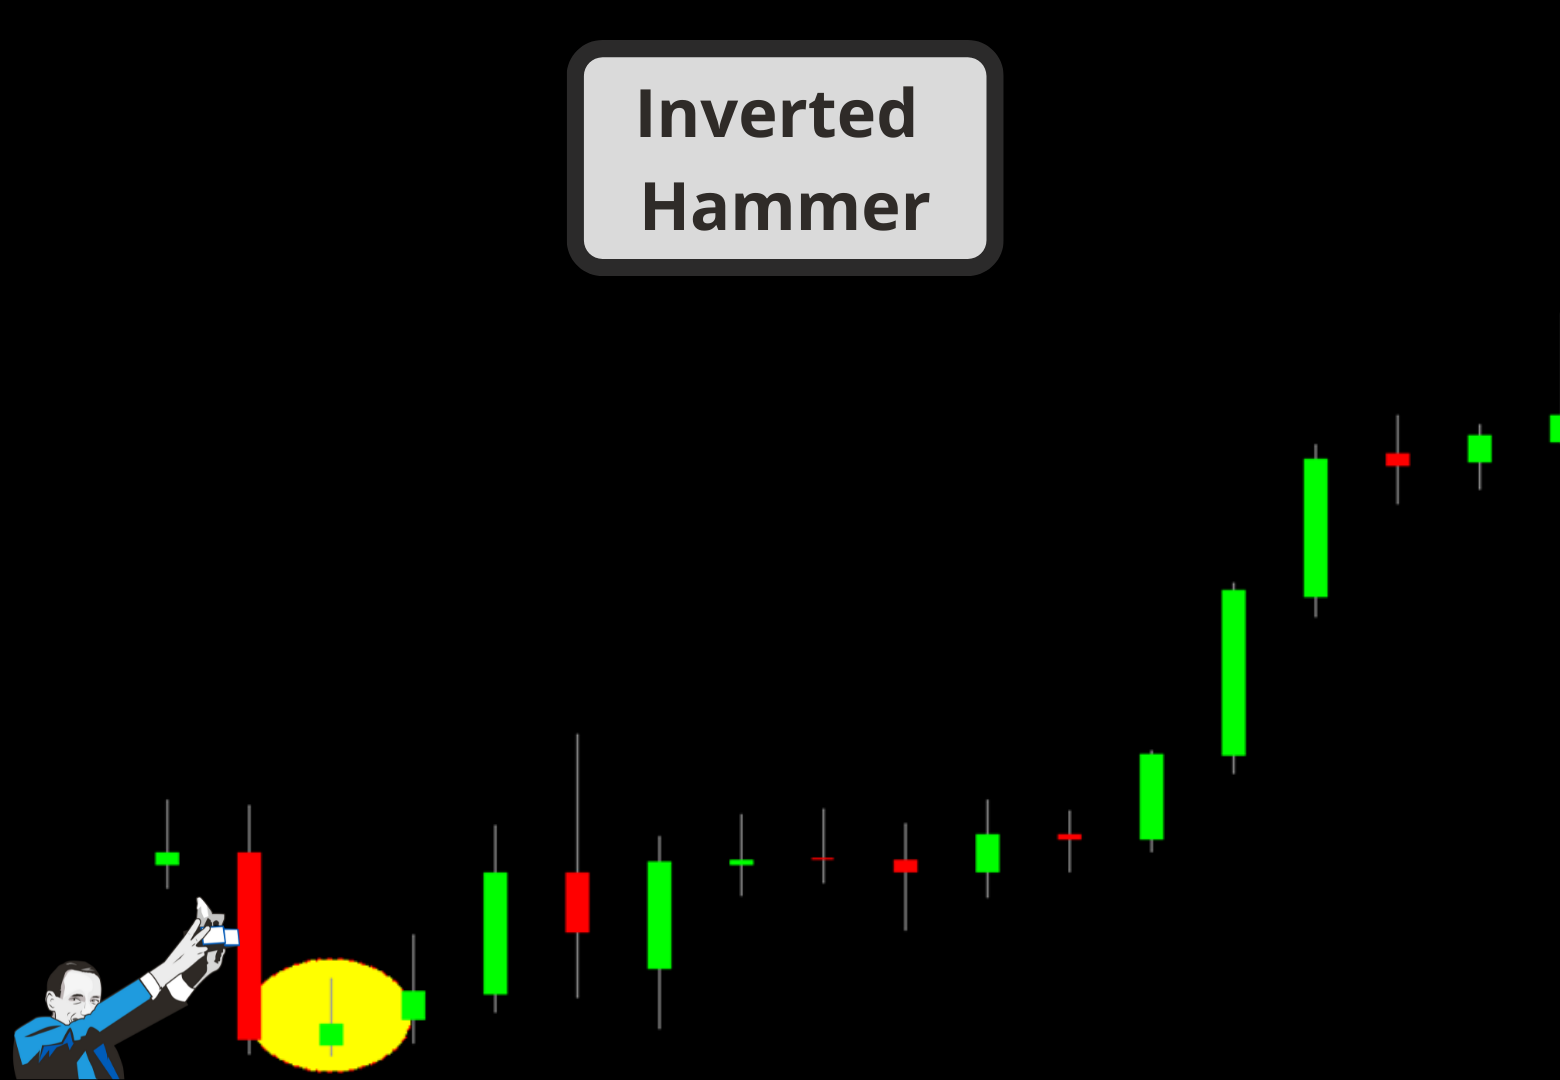
Hammer and Inverted Hammer
A hammer is formed when a candlestick shows a small body and a long lower shadow. The shadow must be at least twice the size of the candlestick’s body. The lower shadow indicates that the price was pushed down by sellers before buyers brought the price back above the opening level.
A bullish hammer is formed when the candlestick closes above the opening level, the closing price is near the high, and the shadow must be at least twice the body size.
An inverted hammer, on the other hand, is formed when the opening price is lower than the closing price. In this case, the long shadow above the body shows an initial push in buying the financial instrument, but eventually, the price was dragged down by sellers.
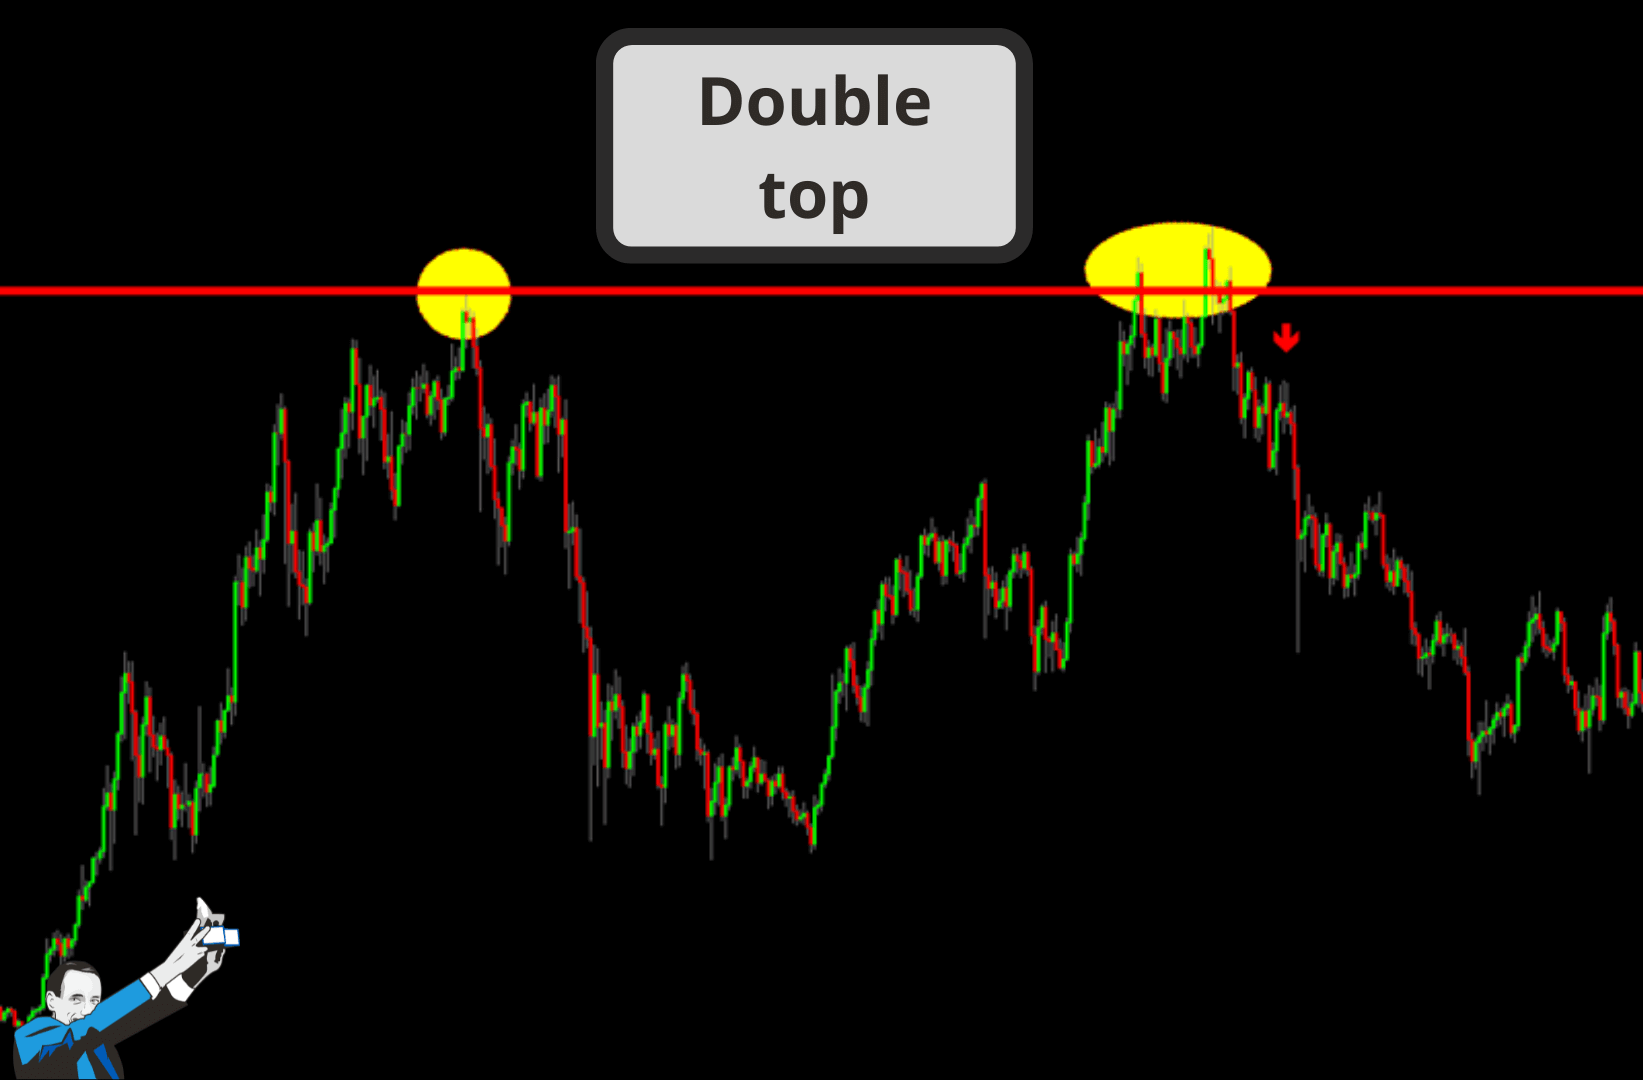
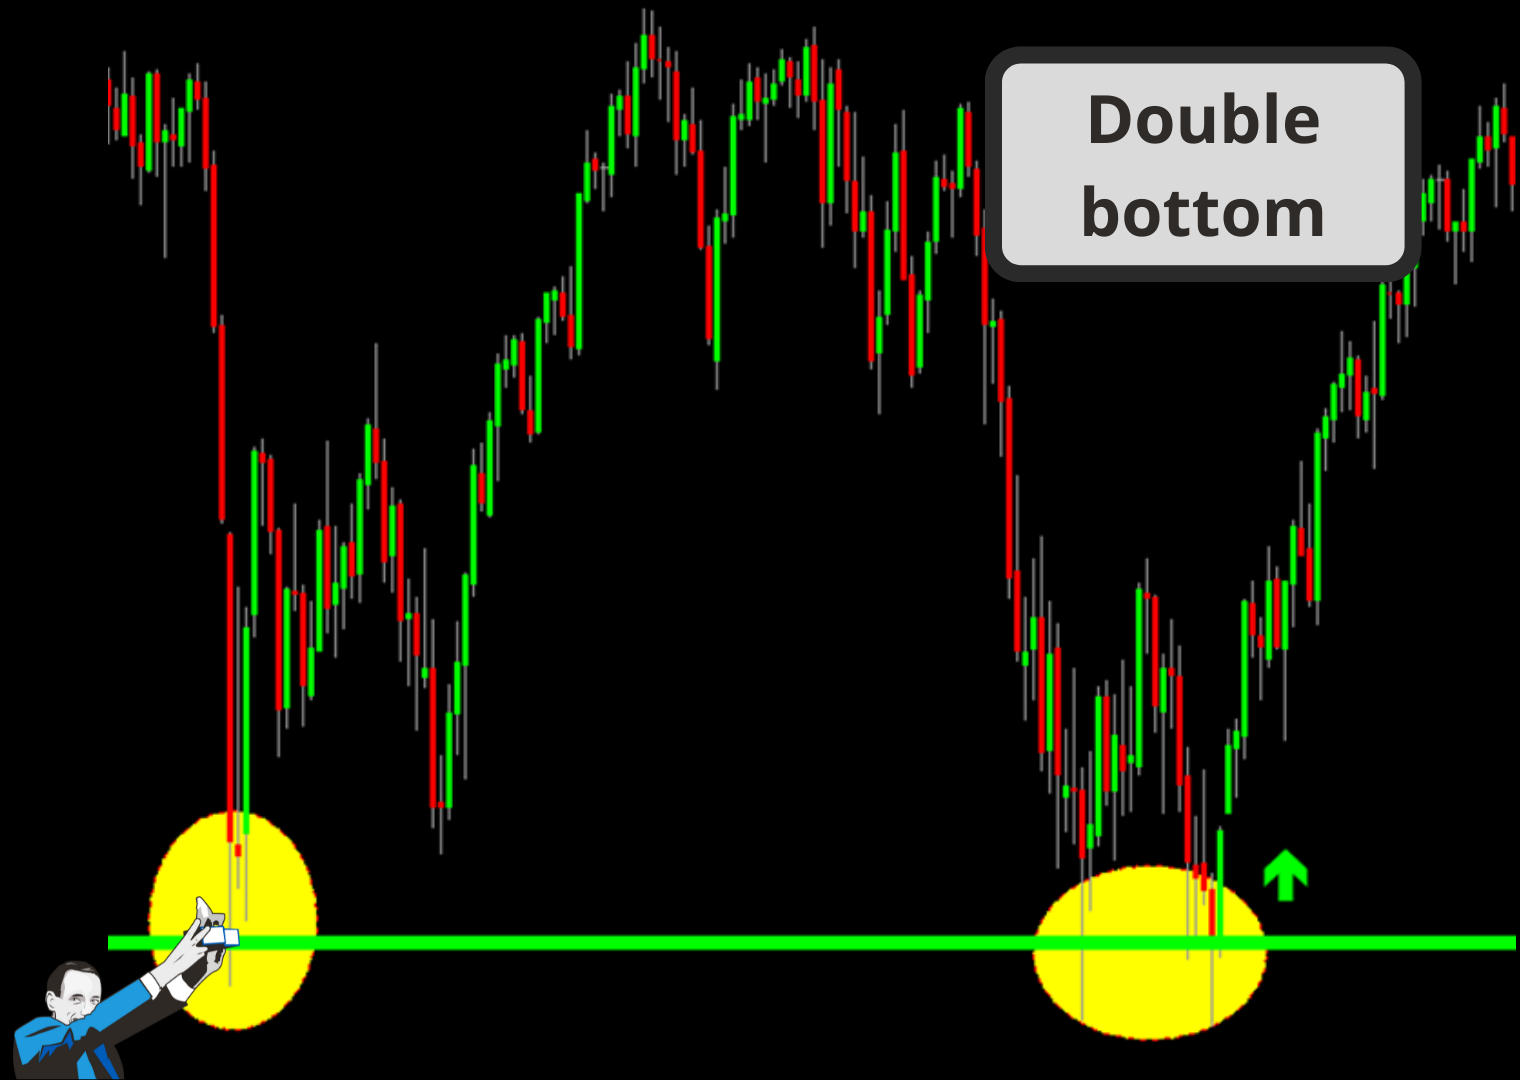
Double Top and Double Bottom
The double top is an extremely bearish pattern that forms after an asset reaches a high price twice in a row.
This pattern is confirmed when the asset price falls below a support level identified by the low of the previous two highs.
The double bottom resembles the letter “W,” as it has two lower peaks in between a moderate upswing. The level reached by the two low points represents the support level.
This pattern is used to detect the end of a bearish trend and the beginning of an upward trend.
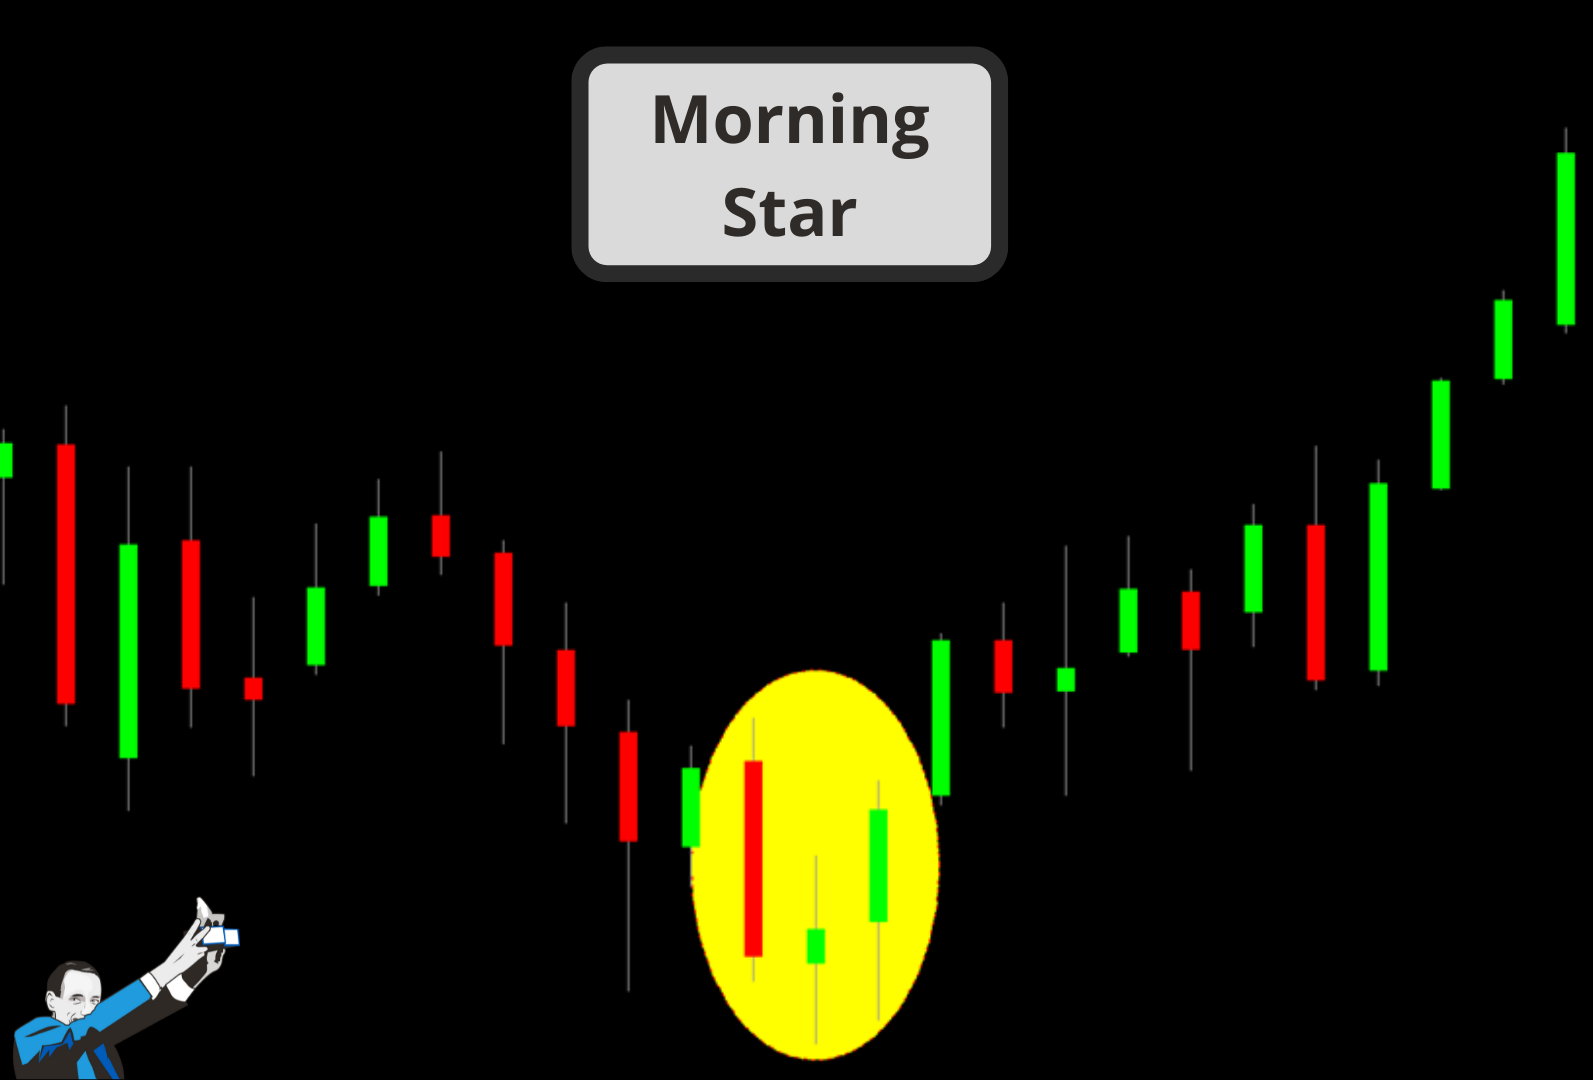
Morning Star
The morning star pattern includes three or more candlesticks and is recognizable by its large bearish candlestick, followed by a small bullish or bearish candlestick with a smaller body than the candlestick’s shadow, then followed by a large bullish candlestick.
This pattern is used to signal a trend reversal and indicates that prices may be rising again.
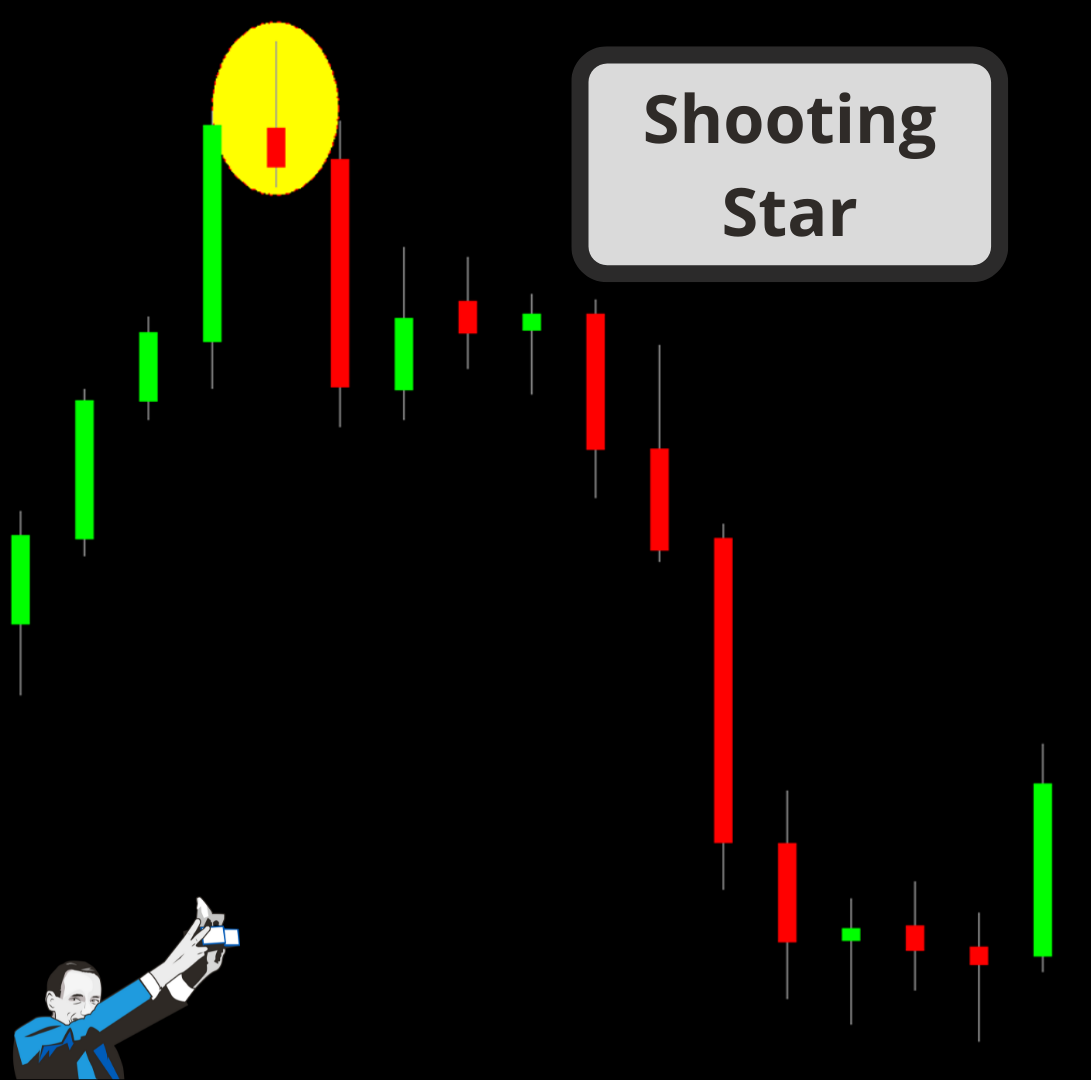
Shooting Star
Sticking with our cosmic theme, a shooting star is a bearish candlestick with a long upper shadow, minimal or no lower shadow, and a small body approaching the day’s low. It’s a pattern that appears at the end of an uptrend.
Traders usually wait to see what the candlestick following a shooting star does. If the price falls, it may make sense to sell, but if the price rises, the shooting star may simply have been a false signal.
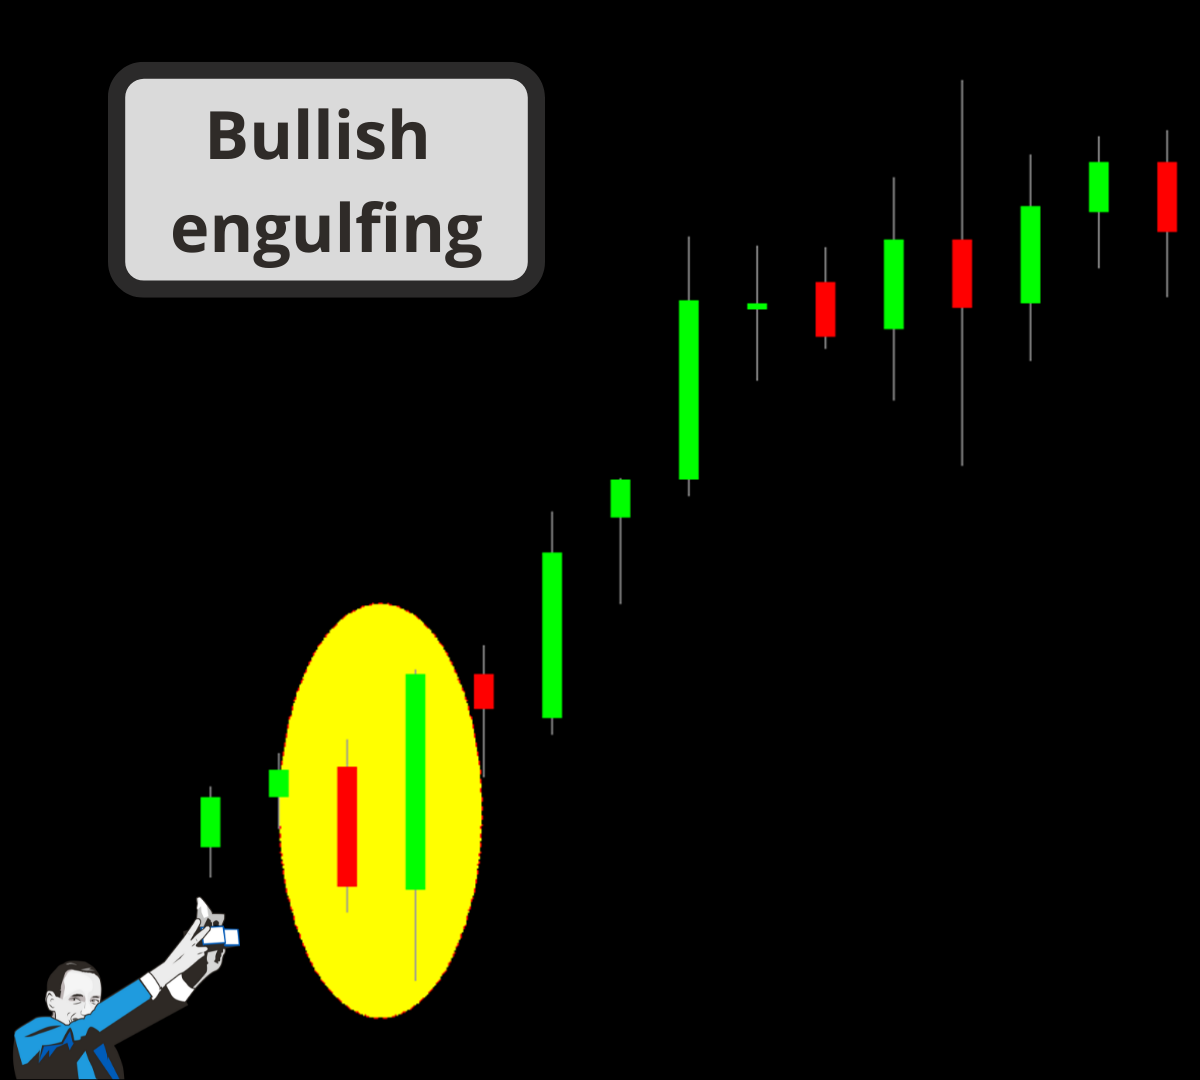
Bullish Engulfing and Bearish Engulfing
The Bullish Engulfing occurs at the end of a bearish trend. It consists of a first negative bar and a second bar that “contains” the entire body of the previous candlestick, meaning that it has a gap-down open and close above the high of the first candlestick.
The word “engulf” may help you understand the concept: the second candlestick is indeed so large that it can swallow the first candlestick in its entirety.
Bearish engulfing is the exact opposite. This pattern signals that the bullish trend is nearing its end and consists of a positive bar followed by a larger bar that opens in a gap up and closes below the low of the first bar.
How Can I Recognize an Effective Pattern?
In this blog, you’ll often hear us say that tests are the best way to see if a theoretical strategy is an effective instrument.
In the video below, one of our coaches at Unger Academy explains how to put a pattern to the test by applying the systematic trading method we use at Unger Academy, namely the Unger MethodTM.
The video shows how to insert the Engulfing Pattern into a trading system and test its real performance.
As shown in the video, coding the Engulfing pattern is quite simple, given the fact that the function that stands for Bullish or Bearish Engulfing is already included in most platforms.
Conclusion
We hope this article has given you a useful overview of trading patterns. This is by no means an exhaustive list, but these are some of the most popular patterns used in trading systems.