What Is a Timeframe in Trading?
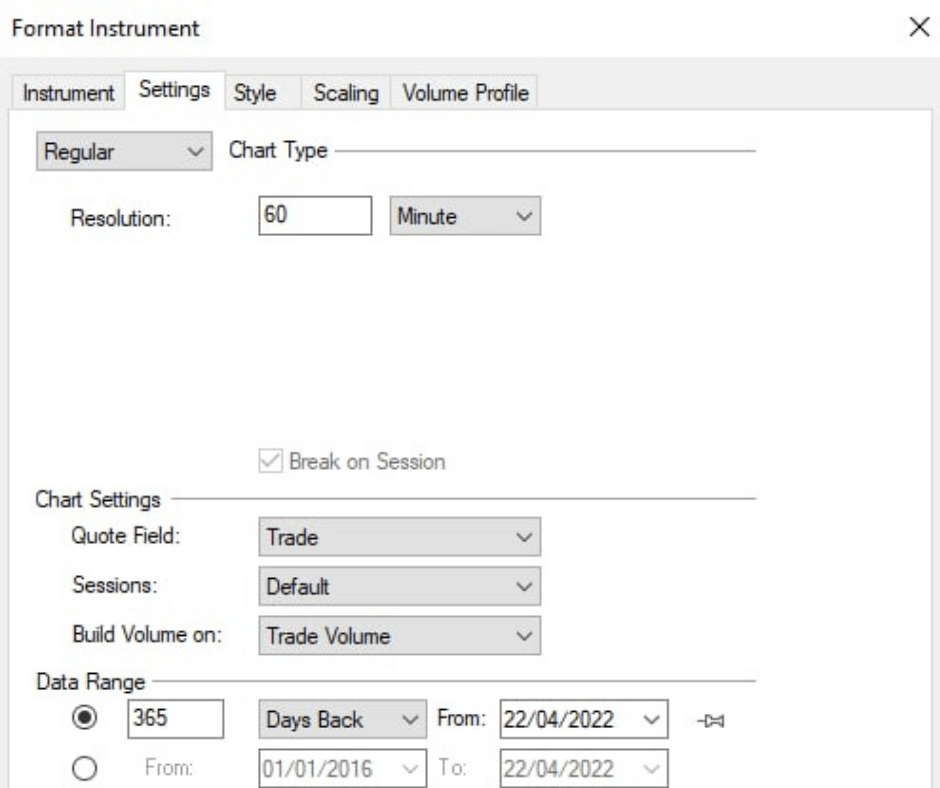
In trading, a timeframe refers to the amount of time over which the performance of a specific asset is analyzed. Bars (or candlesticks) show the variation in the price of an asset over a user-defined period of time, or timeframe.
Candlesticks enable you to see the following information: opening price, closing price, high price, and low price.
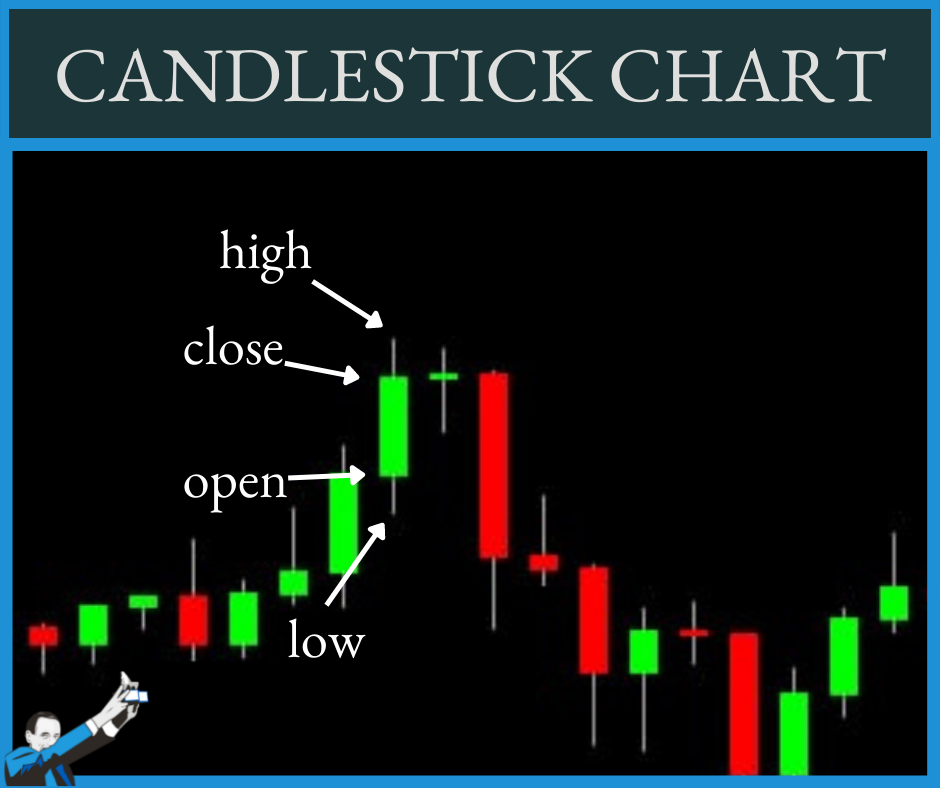
The important thing to remember is that this information depends precisely on the timeframe of the candlestick. For example, if you use a daily candlestick, you’ll see all four prices from the daily session. With a 5-minute candlestick, you’ll see data spanning 5 minutes.
A timeframe is therefore a key variable within a trading strategy, since depending on the parameters selected, the results and effectiveness of a strategy can vary greatly. Indeed, charts based on a very narrow timeframe tell a different story compared to charts based on wider timeframes.
To use an analogy, you can think of a timeframe as a kind of photographic zoom. It’s still the same image, but you can choose to look at it in its entirety and miss some of the hidden details, or you can zoom in to look at the details but lose sight of the big picture.
Similarly, a long-term timeframe in trading gives a comprehensive view of the situation and help to identify general trends, while shorter timeframes show a more immediate and detailed reality of what is happening in the market.
Considering that there are timeframes with intervals that can range from a minute to a month, it’s normal to be thrown off balance if you’re new to trading.
Don’t worry: below you’ll find all the information you need to understand which timeframe to choose based on the strategy you use.
How to Choose a Timeframe
Before going into detail, keep in mind that this article will only discuss the best timeframes for systematic trading, which is the trading method we use to be profitable in the markets without spending hours and hours in front of a monitor.
This means that we won’t deal in depth with timeframes spanning a week or more, as they are generally too slow for our approach.
Instead, we’ll focus on intraday and daily timeframes, which show price movements over timeframes of 5-60 minutes and 24 hours, respectively. In the video below we’ll explain in detail why this is so.
Pros and Cons of Intraday Timeframe
Intraday is trading method in which positions last less than the duration of the daily session of your intended market. In other words, any open position is closed by the time the daily session ends. With regard to timeframes, the term ‘intraday’ refers to time intervals generally ranging from one minute to one hour.
Pros
By using an intraday timeframe, specifically between 5 and 60 minutes, we have the opportunity to monitor conditions that can’t be controlled by working on longer timeframes. Examples include intraday bias, which is the tendency for prices to move the same way within certain time windows.
Using intraday timeframes also yields more accurate backtests than those executed with longer timeframes, such as daily timeframes. As we’ll see later, the daily timeframe can cause inaccuracies in reading the strategy. This problem is generally related to the platform not knowing how prices have moved within the single daily bar.
This timeframe is suitable for intraday trading, or with positions that are closed at the end of the session. This mode of trading may be preferable under various circumstances that depend on the specific characteristics of the market under consideration.
Cons
Regarding the initial stages of studying and coding trading systems, it may prove useful to use a larger time frame: the daily time frame. In this case, the bars of the chart last one day (1440 minutes) and allow for a better assessment of the underlying characteristics of the markets.
Also keep in mind that very short timeframes (between 1-5 minutes) are often affected by market “background noise,” which refers to random fluctuations in prices that hint at a different trend than what is unfolding.
This means that finding pure inefficiencies might be more complicated while working with a 1–5-minute timeframe.
Pros and Cons of a Daily Timeframe
Daily bars last 1440 minutes and target strategies that work overnight, or any system with positions that last longer than the daily session.
Pros
It is a “cleaner” timeframe, and less affected by random price fluctuations. This makes it easier to identify sensitive points in the market while avoiding noise.
Daily timeframes also allow for faster backtesting. Because they hold less data than a 1–5-minute timeframe, the computer has less to calculate.
This is particularly useful when testing an idea over a very large history to check its potential effectiveness, or to identify the general features of a market.
Cons
A daily timeframe can cause inaccuracies in reading the strategy generally related to the platform not knowing how prices have moved within the single daily bar.
To make up for this shortcoming, it’s possible to use an instrument provided by MultiCharts called the Bar Magnifier. This allows the platform to check how prices have moved within the individual bar if you also have intraday data.
Another limitation is the fact that multiple entries and exits occurring within the same bar can’t be effectively measured. This can happen when the width of the daily bar (expressed as a monetary value) far exceeds our stop loss or take profit. In this case, the strategy won’t know whether the stop loss or take profit was executed first, thus invalidating the performance of the backtest.
Conclusion
As you can see, there is no perfect timeframe for every strategy. The choice of the best timeframe in trading depends on strategy you employ.
In general, during the preliminary study stages, where the characteristics of a market have not yet been identified, it may be useful to use a daily timeframe to get an idea of market behavior or to quickly test a trading logic.
After that, once you’ve identified something interesting, to refine the strategy, you’ll need to fine-tune by moving to lower timeframes, such as 15 or 30 minutes. This will allow you to check the accuracy of the backtest and at the same time to verify all those details that can’t be monitored with a daily timeframe.
If you want more details about timeframes, some practical suggestions, and real-world examples, watch the video featured in this article.