Charts are a fundamental tool for trading the markets, whether one adopts an approach based on technical analysis or systems and algorithms.
Generally speaking, a chart is created by plotting or drawing the price trend of a financial instrument over time.
Charts thus provide an overview of price trends and can be useful both for interpreting the behavior of markets (for example, using indicators and other basic formulas of technical analysis) and for extracting reference values useful for developing trading systems (such as opening, closing, high, low, and volume prices).
Since there are various types of charts, it’s useful to have an idea of their general characteristics before choosing a chart for trading.
This article provides a brief but comprehensive explanation of the characteristics of the 3 most common types of charts for trading.
The 3 Most Commonly Used Types of Charts in Trading
Line Charts
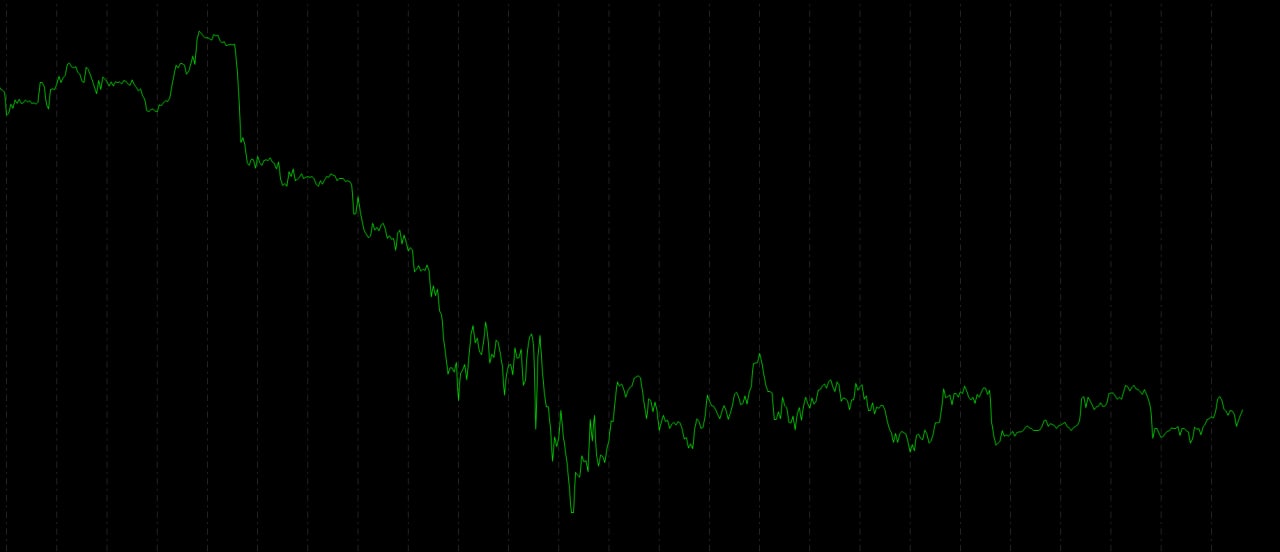
Line charts are the most basic of all charts. They only show the closing prices in a given time frame, such as over the course of a day, and don’t provide additional information such as the highs and lows reached in that period by the financial instrument.
This is why line charts are good for observing general long-term trends, while more detailed charts are needed for in-depth analysis.
Bar Charts
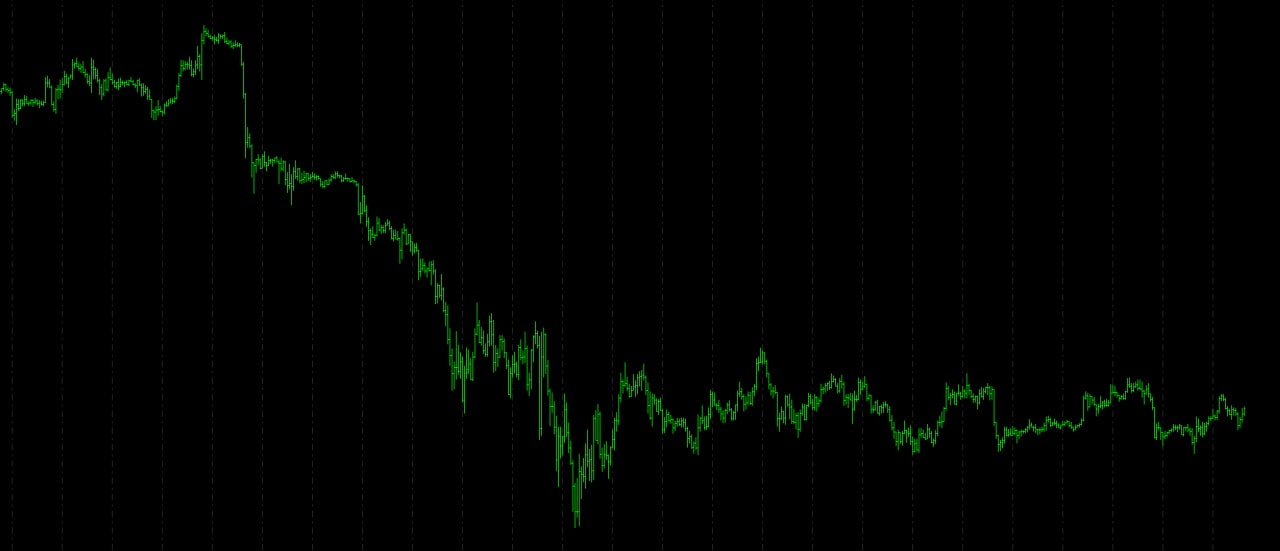
Bar charts provide much more information than line charts. They report the open, close, high, and low prices for each chosen time interval. This is why bar charts are also known as OHLC (open, high, low, close) charts.
This type of chart is widely used by traders because it contains enough information to understand how a financial instrument has moved over a given time frame.
Japanese Candlesticks
This chart, whose bars resemble the shape of a candle, was first used by eighteenth-century Japanese merchants.
Like bar charts, Japanese candlesticks also feature information about the opening, closing, high and low prices.
In addition, this chart is very easy to read and interpret, due to the shape of the candles and the color used to represent the downward (red) and upward (green) phases.
Different Types of Bars
After looking at the main charts used in trading, let’s now discuss the different types of bars that can represent the data in the chart itself. Specifically, we’ll explore the difference between time bars and volume bars (also called “range” bars).
Time bars, as the name suggests, are drawn on the chart when the time interval (also called a time frame) set by the trader has lapsed. If, for example, you choose a daily time frame, the bars will form daily (if you want to learn more on how to choose the timeframe, read this article).
Volume bars, on the other hand, are not represented on the chart according to the lapse of time. These bars are formed when some trading volume is realized, or when the market moves by a certain number of ticks (a tick is a minimum fluctuation, up or down, in a financial instrument).
In this video, Andrea Unger discusses the merits and demerits of both of these instruments.
Is It Better to Use Volume Bars or Time Bars?
As described in the video, time bars are sometimes not very informative. Even if the market has moved only slightly in the selected time frame, the bar will still be represented on the chart. It will then be an “empty” bar with no particular significance and won’t contribute much to the analysis and calculation of any patterns.
With volume bars, on the other hand, each bar has equal importance. A bar will only be created if there has been the same level of activity in the market that led to the creation of the other bars. So overall, a trend plotted with volume bars tends to have greater importance than time bars.
However, this does not mean that volume bars are necessarily better. We prefer time bars.
It’s possible to guard against the occasional lack of usefulness of time bars by using appropriate hourly filters.
As explained in the video, our advice is to place entry and exit orders only at certain times of the day. If these time intervals are correctly identified, it’s possible to consider only the most significant moments in the market, ignoring uninformative or overly chaotic phases.
Conclusion
With this brief article, we hope we provided you with an overview of the main charts used in trading. In general, all of these tools have the basic task of intuitively representing what happens in the market.
As a final piece of advice, as explained by Andrea Unger in the video above, try not to get bogged down in finding the perfect setup.
If, for example, you’re comfortable using volume bars, then do so; there are no particular contraindications. But consider that with some care, time bars can be just as useful, so don’t invest too much time in seeking absolute perfection from the start.