A famous proverb says: “strike the iron while it’s hot,” and in a sense, this is exactly what momentum strategies do. What does this approach consist of and why does it work so well? In this article, we will define momentum strategies, the indicators that measure it, and how you can use them for trading, especially in intraday mode.
What Are Momentum Strategies?
As the name suggests, momentum strategies seek to exploit the moment of a strong market trend. Those who adopt this approach are convinced that strong trends, both bullish and bearish, tend to persist in the same direction in the short-medium term. This is due to the fact that when a movement is strong, more and more investors and traders are “attracted” and led to follow it.
This is the so-called “herd effect” that pushes many traders to imitate what most traders are doing at that moment, fueling and actually reinforcing the current trend. Imagine the behavior of momentum traders as a flock that moves compactly in the same direction.
In practice, momentum traders focus on the central moment of a trend, taking into consideration only the price trend. Their goal is to take advantage of market sentiment by striking the iron while it’s hot.
How Momentum Strategies Work
As we have mentioned, momentum strategies take into consideration only the price trend. The basic principle of this approach is that if there is a strong movement, then the market will continue to move in the same direction – either long or short – in the short to medium term (the idea is similar to that of trend-following).
Momentum can have a:
-
Positive value: when the trend is bullish and the current price is higher than the prices of the past N periods.
-
Negative value: when there is a downtrend and the current price is less than the prices of the past N periods.
Momentum strategies are generally used in intraday trading and work well on highly volatile markets that have high volumes and a strong directionality.
Technical Indicators to Use in Momentum Strategies
To measure the rate of price change and the strength of a trend, momentum traders can use several technical analysis indicators, including:
-
Momentum
-
ROC (Rate of Change)
-
RSI (Relative Strength Index)
Let’s see them in detail.
Momentum Indicator
As the name implies, “momentum” is undoubtedly the most important indicator in this strategy. From a mathematical point of view, momentum is equal to the difference between the most recent closing price and the closing price of n days ago.
The value of n is arbitrary. However, most trading platforms have 10, 12, or 14 days as a default value. Obviously, the higher the value of n, the more reliable the result.
On a graphical level, the momentum is represented by a line that moves around a central reference line. If the momentum line intersects the reference line upwards, it means that the current price is higher than the past price and, therefore, there is potential for a bullish trend.
If, on the other hand, the intersection occurs from top to bottom, it means that we have a potentially bearish movement.
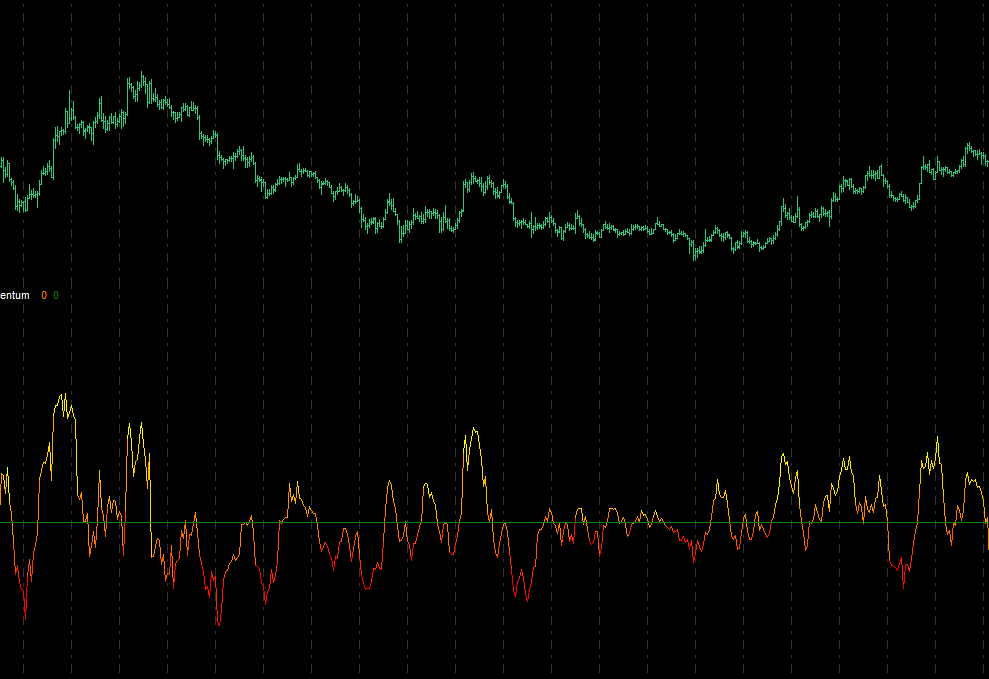 Momentum applied to an historical data series.
From an operational point of view, an intersection with the zero line upwards indicates a strengthening of the buyers and can trigger long strategies. Conversely, a decreasing trend indicates a strengthening of the sellers and can trigger short strategies.
The momentum indicator can be evaluated in two ways:
-
Absolute: if we consider the price of the instrument with respect to itself
-
Relative: if you compare the price of the instrument with that of others in the same sector.
ROC (Rate of Change)
Like momentum, the Rate of Change indicator is used to measure the price change of an underlying asset compared to the price of n periods ago (the value of n is arbitrary).
The main difference between momentum and ROC is that the former is expressed in absolute value while the latter is expressed as a percentage.
RSI (Relative Strength Index)
The Relative Strength Index is an oscillator whose value can vary from 0 to 100. This indicator is generally used to identify overbought situations (if it rises above 70) or oversold situations (if it falls below 30).
To better understand how this indicator works, we recommend that you read our dedicated article.
Other indicators used in momentum strategies are the Stochastic, CCI, MACD and WILLIAMS %R.
How Momentum Traders Operate
Generally, momentum traders tend to operate intraday and in phases of high volatility. Those who adopt this strategy avoid keeping positions open overnight. They exploit enthusiasm in the markets to take long positions and feelings of fear and panic to go short.
Why Do Momentum Strategies Work?
At first glance, momentum strategies might appear counter-intuitive: it should be more logical to enter the market when prices are low and not when strong trends are already in place.
But why, then, do these strategies work?
A possible explanation relates to behavioral finance and the so-called “herd effect”. Many traders tend to mimic what others are doing so they buy if everyone is buying and sell if everyone is selling. This only reinforces the current trend.
This effect persists until a significant number of traders start to believe that prices are not in line with those of the market and the trend reverses.
Conclusions
Momentum strategies are based on the idea that if there is a strong trend, be it bullish or bearish, it is worth following it because in the short to medium term the market will continue to move in the same direction due to the “herd effect.”
The assumption behind this approach is that most investors and traders tend to mimic what others are doing, buying or selling at the same time as other traders. This, in fact, only further reinforces the trend. Obviously, the risks of a sudden shock on the markets are always around the corner, so it is essential to know this strategy well and understand how to use it correctly.