
In this article, we’ll discuss a very interesting pattern known in trading as the end-of-month rally. We’ll see what it is, in which markets it occurs, and the results it offers when exploited in a trading strategy.
What Is the End-of-Month Rally?
In general, a “rally” is a period of sustained increases in the prices of an asset.
A rally often occurs when expectations for a company suddenly rise. A classic example is Apple, whose stock rises in value every time a new iPhone model is announced. In such cases, many traders decide to invest early to benefit from the subsequent growth in stock value.
Another example is the so-called Christmas rally, in which stock markets see a consistent rise in the last weeks of the year. This mechanism mainly affects U.S. markets, but is also marginally present in other areas.
The end-of-month rally, as the name suggests, occurs in the last days of the month, mainly in the stock market and sometimes in the bond market.
Around the end of a month or the beginning of the next, both individual traders and institutional traders buy stock and bond assets to reallocate their funds. This massive movement of capital results in a general increase of prices in this specific time window.
How To Take Advantage of the End-of-Month Rally
Because end-of-month rallies are recurring movements, they can be used in bias strategies. Bias strategies operate during specific time windows to exploit consistent price fluctuations. In this video, Andrea Unger shows the ease of creating a bias system based on the end-of-month rally; simply trade at the end of each month.
The strategy presented by Andrea applies to the S&P 500, which is the main U.S. stock index and tracks the performance of America’s 500 most capitalized companies.
As you see in the video, Andrea initially uses a very basic strategy, and the results are quite satisfactory.
The main drawback of such a strategy is that you are forced to remain in the market for most of the month, exposing yourself to more risk.
Therefore, as you can see in the video from 5:20 onward, Andrea sets a strategy where we’ll enter only if a pullback occurs. So, the close of the day before our entry must be below half of the previous monthly range.
The results of this operation are interesting. Although profits drop slightly, which is normal given that we’re in the market for a much shorter time frame, drawdown drops sharply, which is a very important advantage.
Andrea also adds a parametric stop loss, as shown in the video from minute 6:35 onward. By adding a stop loss to the trading system, the drawdown worsens slightly and the profits improve a bit. Another interesting thing to note is that with this setup the system gains every single year, whereas with the “basic” rally we would have had losses in 1998.
The good news is that this strategy works not only in theory but also in practice, and with some additional settings it offers even better performance.
Lastly, you’ll see in the video that the strategy also works well on other US markets, such as the Dow30 or Midcap. However, the results are downright bad when we consider non-US markets, such as the Euro/dollar future or a DAX future.
We can therefore conclude that the end-of-month rally can be successfully applied, but only to the U.S. stock market.
End-of-Month Rally Applied to Cryptocurrencies
In today’s market, many traders and institutions reallocate their funds into cryptocurrencies. This practice led to the development of an end-of-month rally in some crypto markets.
According to the results of a series of tests we show in one of our videos, we can also talk about end-of-month rallies on Bitcoin and Ethereum, the world’s two leading cryptos by capitalization.
End-of-Month Rally Results for Bitcoin and Ethereum
As shown in the video, both markets exhibit a bullish bias, which we identified using our proprietary software called Bias FinderTM.
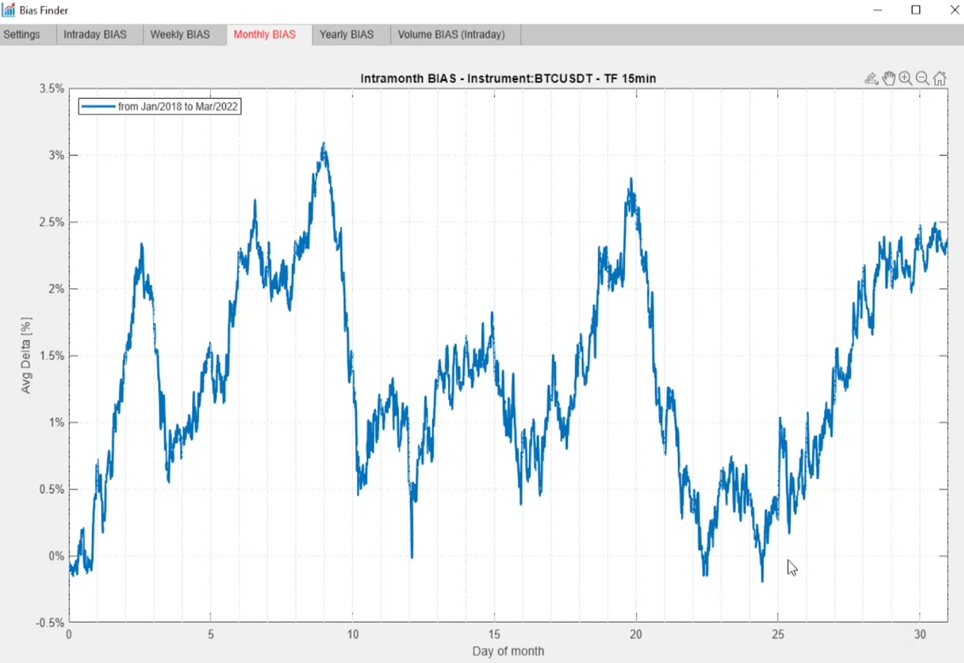
This screenshot of our software shows the average trend of Bitcoin over a month. You can see that from the 25th to the 3rd of the following month, the market has a notable bullish trend.
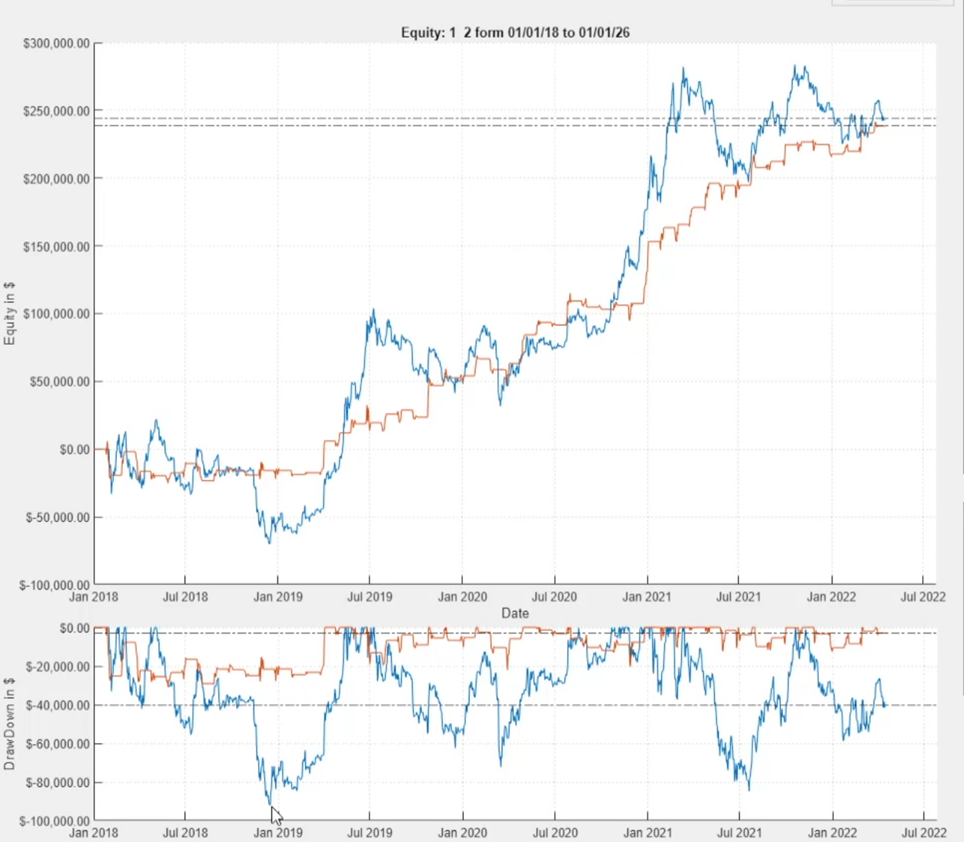
The strategy shown in the video exploits this very trend and produces extremely interesting results. Indeed, you can see how profits remain virtually unchanged compared to buy and hold (a strategy of buying and holding an asset while waiting for its price to rise), while drawdown is reduced by about one-third.
Not to mention that this approach leaves us in the market for a week rather than a whole month, reducing risk.
In the chart below you can see a comparison between the equity curve of a buy and hold strategy without the reinvestment of profits (blue), and a strategy based on the Bitcoin end-of-month rally (red).
These results are quite interesting already, but as shown in the video, even better performance can be achieved by applying such a strategy to Ethereum.
Conclusion
In summary, the end-of-month rally represents an extremely attractive market bias that can be effectively exploited not only in the stock market, where it has been present for many years, but also on newer assets such as Bitcoin and Ethereum.
If you’re interested in learning more about some of the topics covered in this article, you can read our guide to using stop loss or our article on drawdown.