
Maturing profits in trading takes time, patience, expertise, and steady nerves. It’s therefore natural for any trader to do everything possible to protect these hard-earned profits.
One possible solution is the use of asset allocation models proposed over the years by various investment experts. There are many models to choose from, and in this article, we’ll consider a particular model known as the Permanent Portfolio strategy.
If you are interested in understanding, evaluating, and applying the Permanent Portfolio strategy, read on.
What Is Asset Allocation?
The term “asset allocation” refers to a set of strategies that aim to balance the risk-return ratio in a portfolio. This balance is structured based on specific needs and circumstances, including time horizon, risk tolerance, and short/long-term goals.
There are many different asset allocation models. Some well-known models are the 70/30 model, which involves allocating 70% of one’s investments in equities and 30% in bonds, or Ray Dalio’s All Weather model, to which we also dedicated a video.
What Is the Permanent Portfolio Strategy?
The Permanent Portfolio strategy is a year-to-year rebalancing portfolio devised by analyst Harry Browne in the 1980s. It features 4 different and balanced assets, with each asset making up 25% of the entire portfolio.
These 4 asset classes are U.S. equities, long-term U.S. government bonds, pure cash, and precious metals, particularly gold. There are some variations of this model. For example, you can replace the 25% cash with short-dated bonds.
The purpose of the Permanent Portfolio is to ensure positive performance regardless of market conditions. Each asset class can outperform the others during different market phases.
Stocks serve during periods of prosperity and growth, long-term securities serve during periods of prosperity and deflation, cash is suitable during periods of recession, and metals help particularly during periods of inflation.
Is the Permanent Portfolio Really Useful?
As always, the best way to evaluate the performance of an instrument or strategy is to test it on the field.
In the video below, one of our coaches at Unger Academy analyzes the results of a backtest applying the Permanent Portfolio strategy to the last two decades. We will focus on three of the most critical phases in world economic history, namely the 2008 crisis, the dotcom bubble, and the Covid crisis.
The 2008 Crisis
As you can see in the video, the first test is carried out on ETFs, and the model produces consistent results over the years.
Regarding the period between 2008 and 2009, we can see that the model suffered slight losses and a maximum drawdown of 14.07%.
Although these numbers don’t seem particularly attractive, they take on greater interest when we consider the benchmark, namely the S&P, which had a 57% drawdown over the same period, as shown by the equity lines below (in black the Permanent Portfolio model, in red the benchmark).
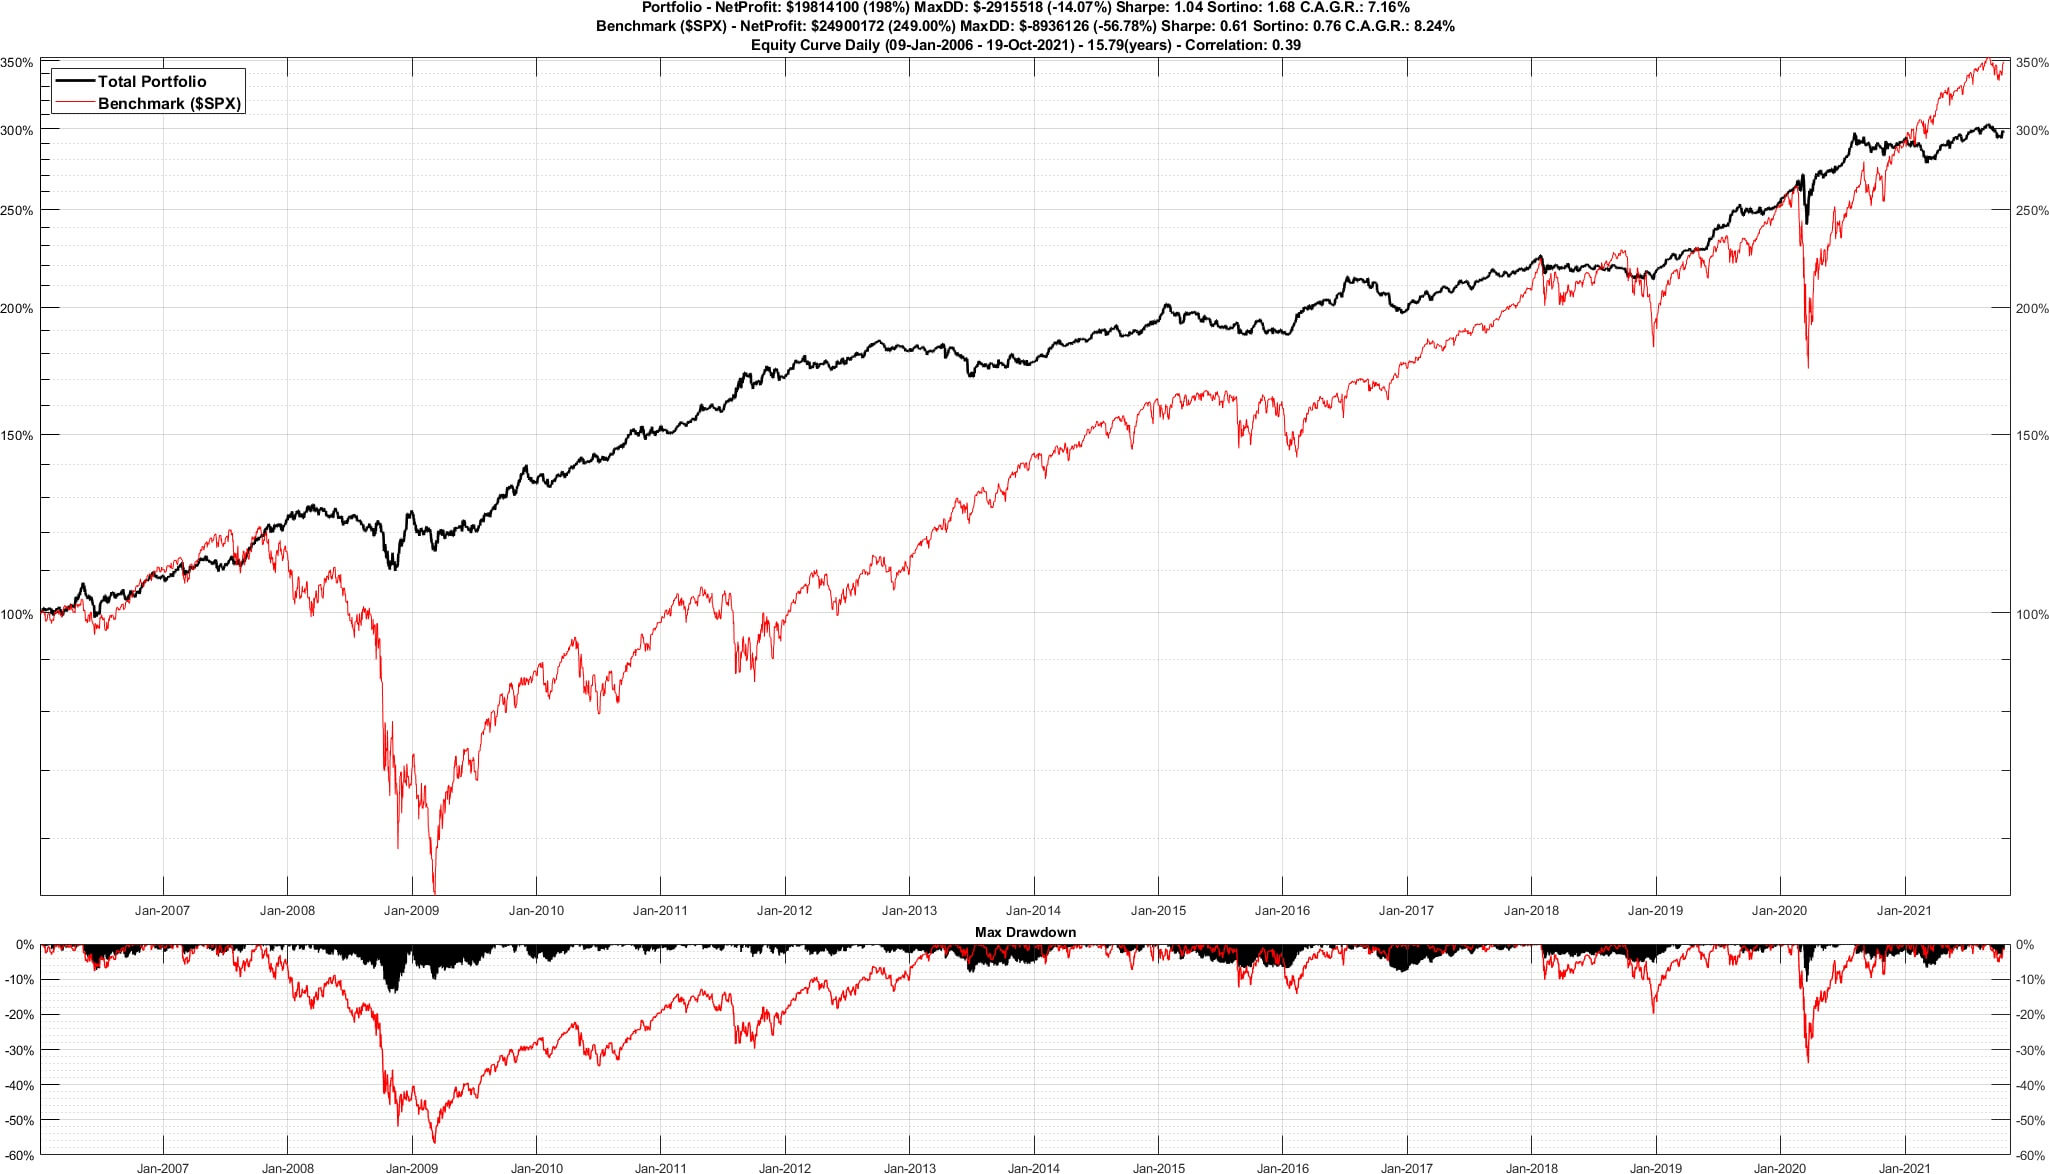
We can conclude that while this model failed to generate profits, it would still have protected investors from the most adverse market phases.
The Dotcom Bubble
The second case particularly affected the U.S. NASDAQ index at the beginning of the millennium when the bubble generated by a very strong growth in value of many technology companies burst.
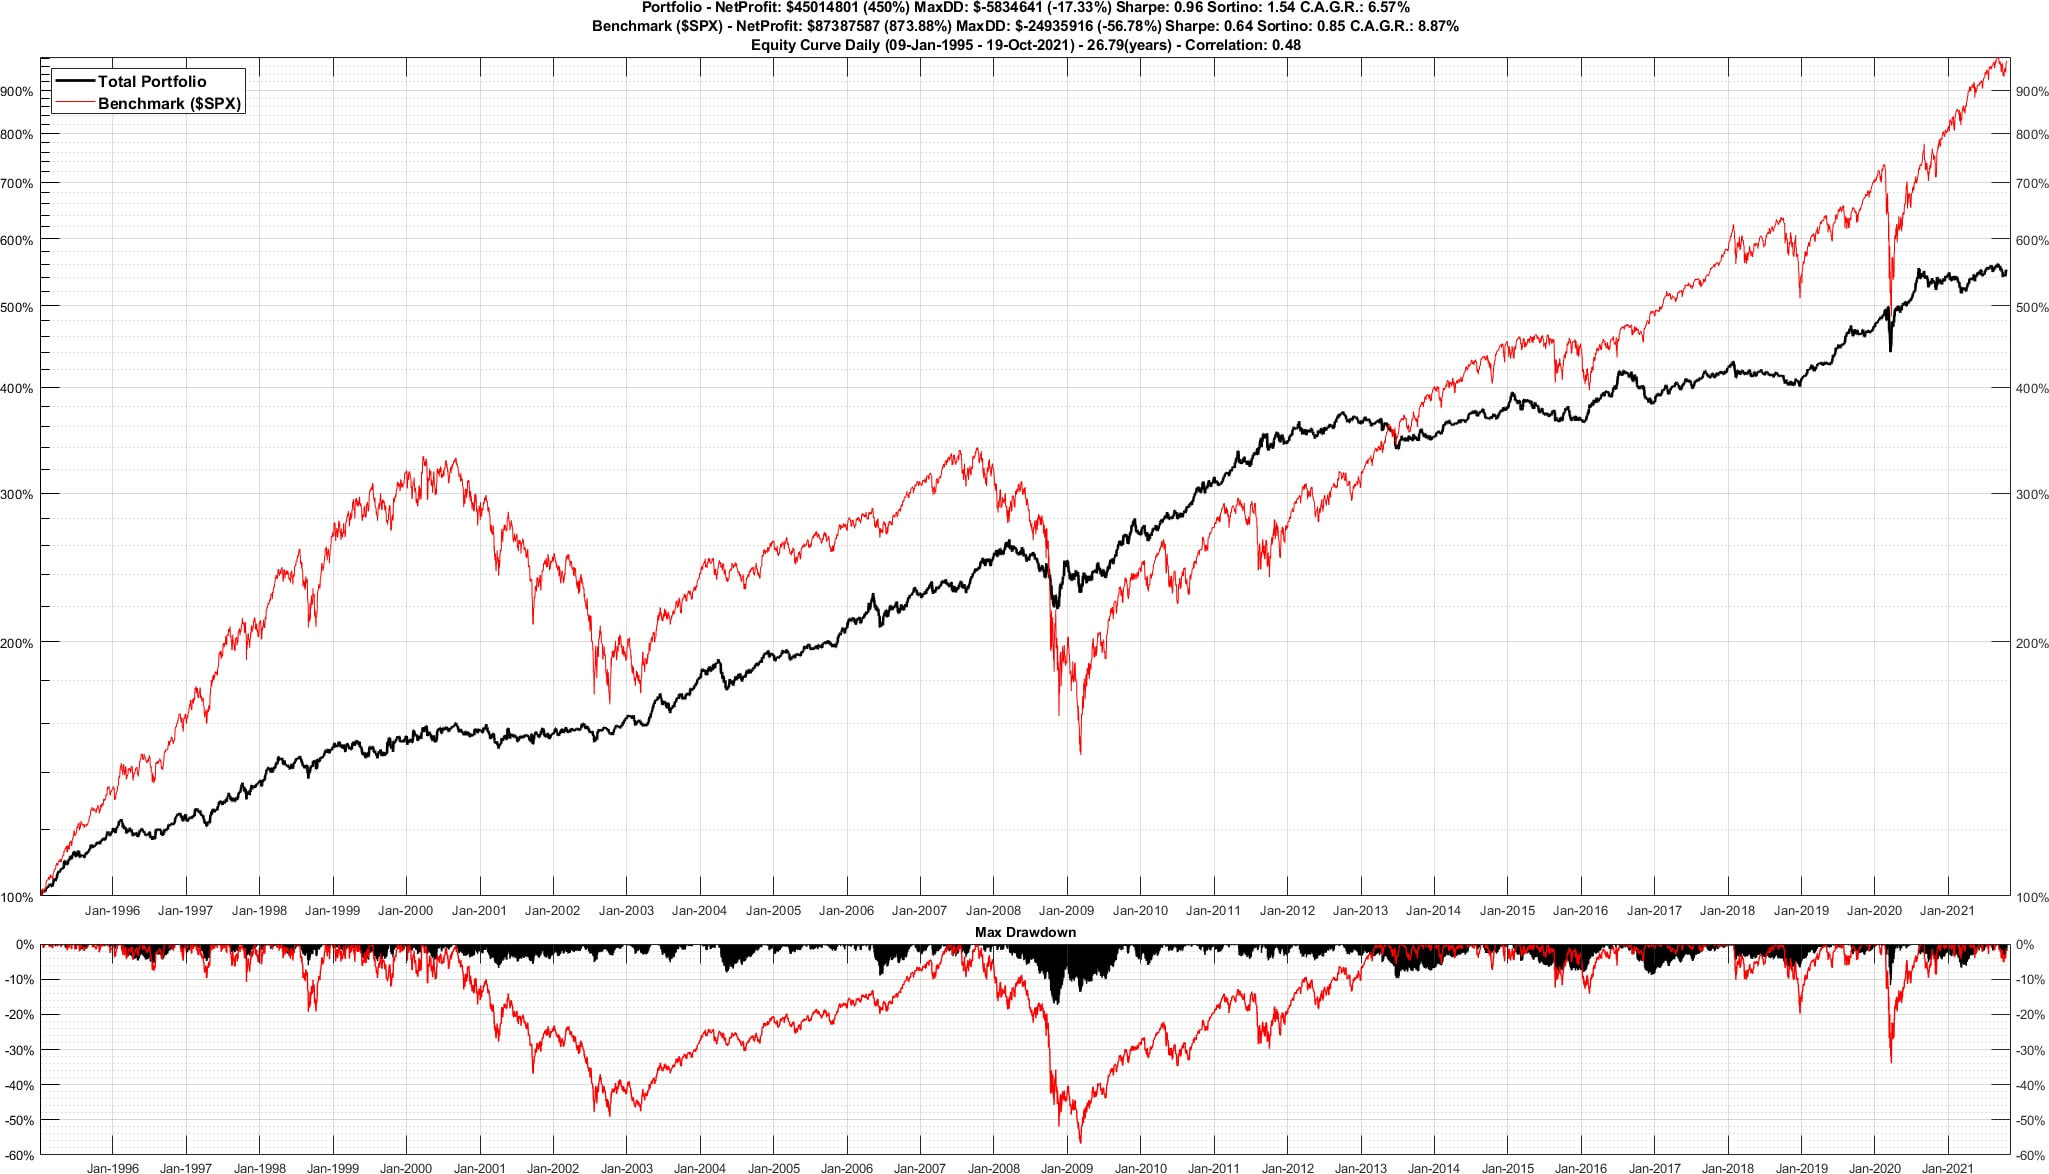 The test started in 1995, which was the year the bubble began to form. Again, we can see a fairly steady trend, much more linear than that of the S&P 500. Our model even generated some hypothetical gains where the benchmark suffered very substantial losses.
As in the previous example, the Permanent Portfolio strategy accrued a much lower drawdown than the benchmark.
The Covid Crisis
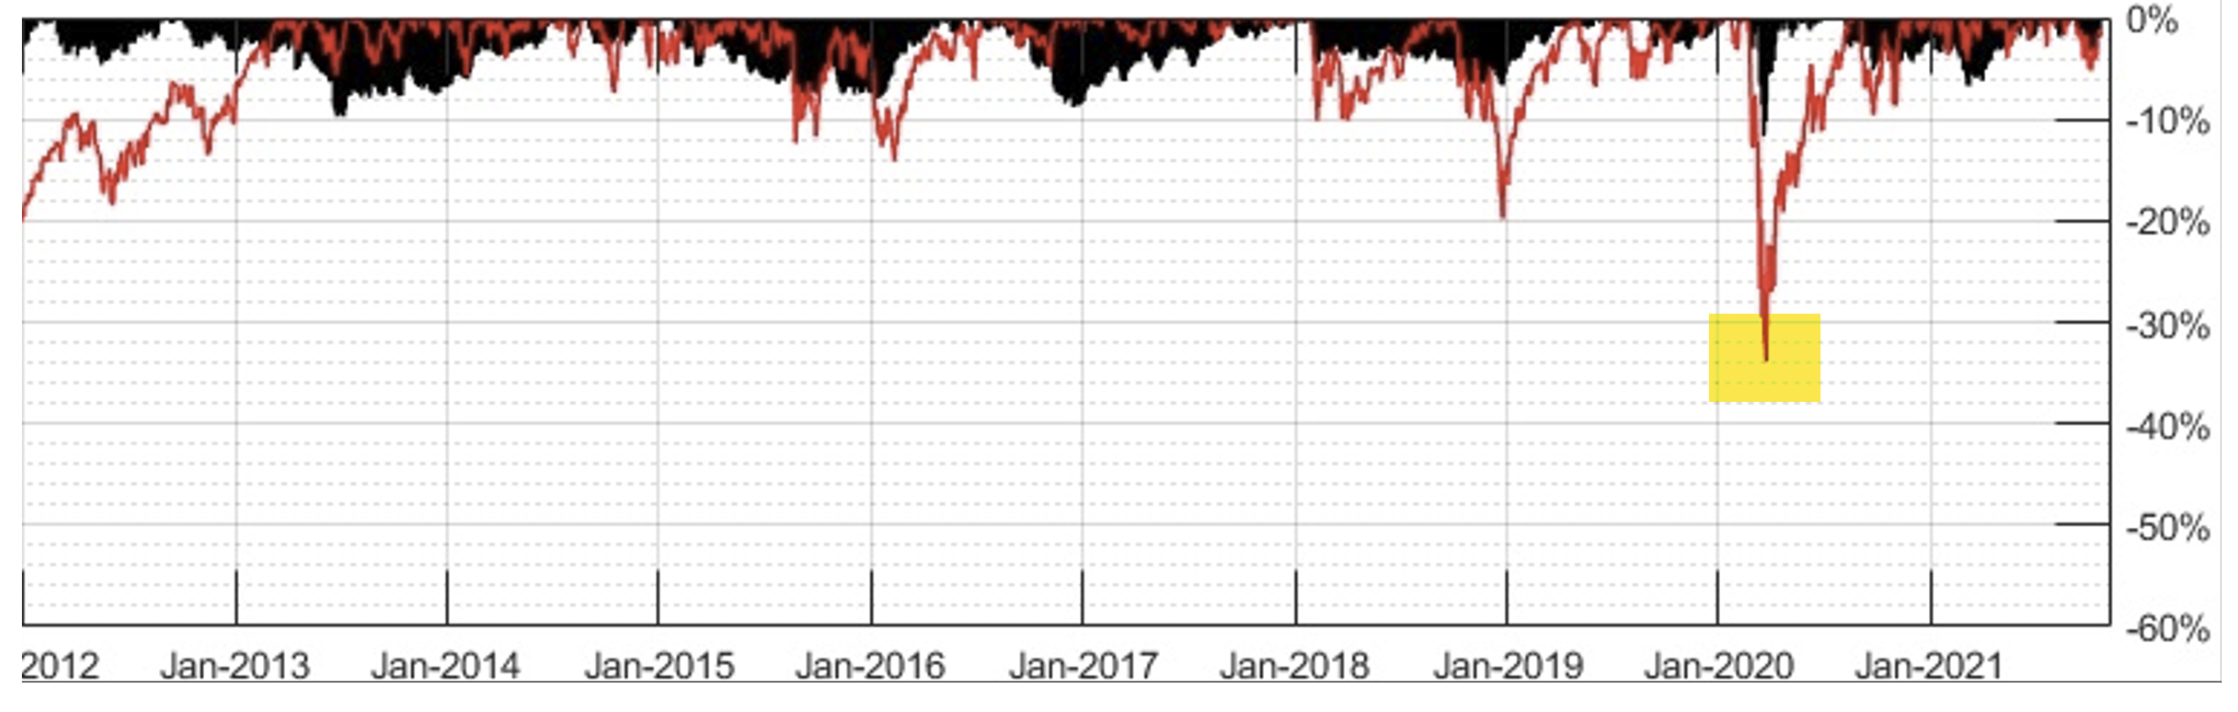
In more recent times, a critical moment occurred around March 2020, when COVID-19 first rocked the world.
In the chart below we can see a cusp that corresponds to the crisis triggered in the markets by the pandemic. Again, we note that our setup didn’t exceed a 12% drawdown, compared to 30-35% for the benchmark.
Conclusion
We hope this article has given you a clear overview of the Permanent Portfolio strategy.
Our test showed us that it’s a simple strategy to follow and has the potential to produce very interesting results.
In addition to offering protection during the most critical market phases, this model also allows for low commission costs associated with portfolio rebalancing, since this process is done on an annual basis.