In a previous article, we talked about Bollinger Bands, a very well-known indicator. In that article, we looked at some application strategies for this indicator, for example, a mean-reverting strategy or the Bollinger Squeeze.
In this article, we’ll focus on an instrument derived from Bollinger Bands called the Bollinger Band Width. We’ll define it, explain it, and give a practical example of how you can use it from now on to improve the results of your systematic trading.
What Is the Bollinger Band Width
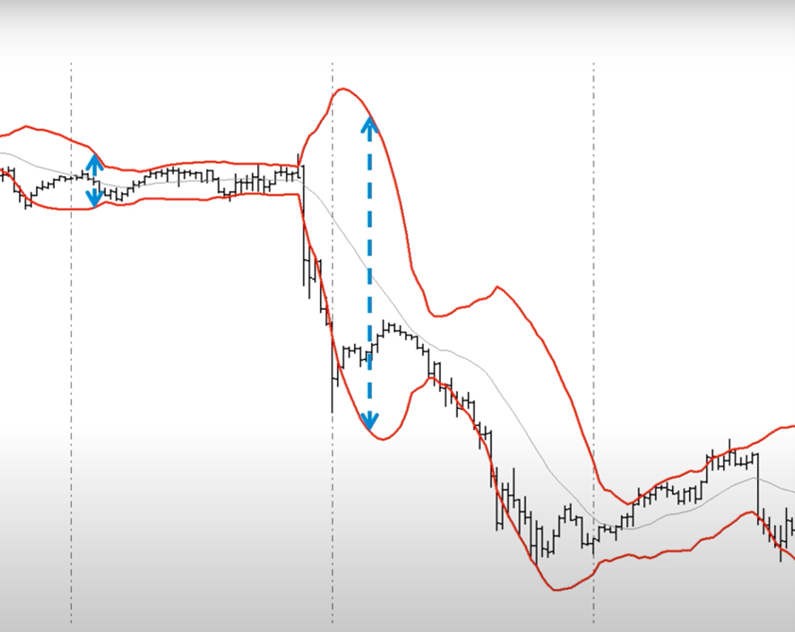
The Bollinger Band Width (BBW) is the distance between the two bands that make up the price channel defined Bollinger Bands.
The Bollinger Band Width makes it easier to visually identify new highs and lows. It is defined by alternating phases of volatility compression and expansion.
Phases of flat calm, where volatility is very low, are usually believed to be followed by sudden movements that indicate a volatility explosion. In the chart above, you can see that in conjunction with the collapse of the asset’s price, a sharp change in volatility occurs.
These types of movements can be exploited and leveraged with trend-following entries, an example of which we’ll see shortly.
We’d also like to point out that the Bollinger Band Width is particularly useful in the Bollinger Squeeze strategy. Whenever the Bollinger Band Width is at a significant minimum, a trader has a good opportunity to execute a Bollinger Squeeze trade.
How to Exploit the Bollinger Band Width in Systematic Trading
BBW can also be useful for us systematic traders. By measuring the distance between the two bands caused by the price excursion, we can measure market volatility.
The difference between the two bands can then be used as a filter for market entries; a narrowing of the width between the two bands is a condition for entry.
In this video, you’ll see BBW applied to a trend-following strategy, simply buying an asset when its price trend goes up and selling when its price trend goes down.
The strategy presented is an intraday strategy (all positions are closed at the end of the day) and enters in trend-following on the levels of the high and low of the previous day. To better understand this concept, we recommend that you watch this short video. If you want to skip the theory and go straight to the practical example, start watching from 3:50.
As you see in the video, our coach compares the performance of this strategy, with and without BBW. Note how this strategy is used on a very diverse basket of futures spanning several different markets (energy, metals, equity indexes, and commodities) on data running from 2010 to 2020.
The BBW-based filter presented in the video is very simple: create a variable containing the value of the difference between the two bands. Market entries are allowed only when this variable, which indicates the BBW, is below a certain threshold.
In turn, this threshold is defined by an input, which can be a preset exact value, or, for greater uniformity when backtesting multiple markets, a percentage of the last market close.
In this way, the conditions required to open long or short positions will be twofold: reaching the high or low of the previous day and having a distance between the two bands less than a certain threshold.
Final Remarks on Bollinger Band Width in Systematic Trading

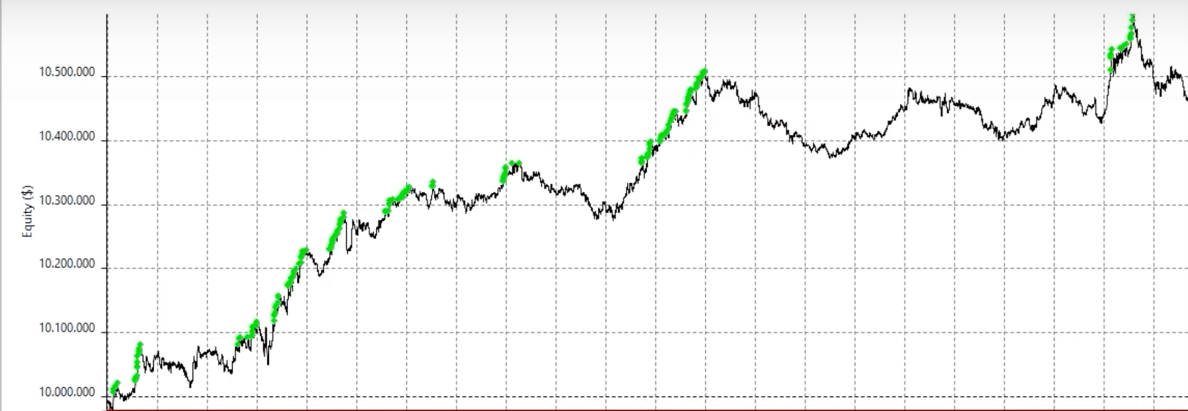
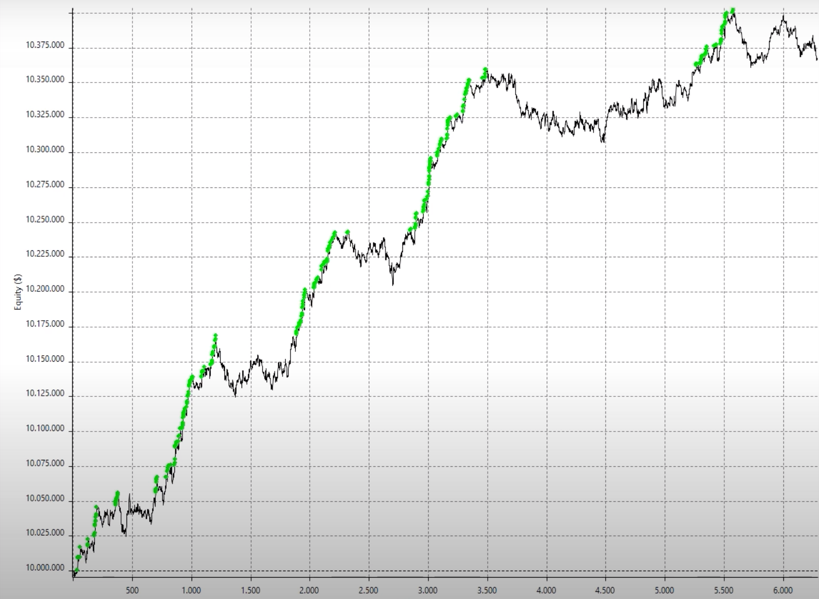
Equity line with BBW filter.
In short, limiting trend-following entries based on market volatility levels produced good results in our test.
If you still have any doubts in this regard, we recommend watching the video again or reading our introductory article on Bollinger Bands.


