Moving averages are among the most commonly used technical indicators in trading. There are several types, each with different characteristics and settings. In this article, we’ll explain how they work and how they can be used in trading systems. We will also give you some tips on how to create a very promising system based precisely on moving averages.
What Are Moving Averages
In technical analysis, moving averages are indicators that express the average price trend of a financial instrument over a given “moving” period of time.
Unlike the classical average, the moving average gradually replaces the the most remote recorded value by gradually replacing it with the most recent value.
In this way, one obtains an average value that refers to a certain number of observations, such as 50, 100, or 200, but can express the market trend.
How to Calculate a Moving Average
Generally, a moving average is calculated by dividing the “moving” price values of a financial asset in relation to a fixed number of recorded values by the reference period “n.”
For example, if we wanted to calculate a 50-day moving average, we would need to consider the price values of the last 50 days of a given asset, removing the most remote value each day and adding the most recent value.
Usually, the closing price of a stock market session is used to measure a moving average, but opening prices or lows or highs can also be taken into account if desired.
There is also much freedom in defining the reference time frame: it’s possible to calculate the moving average on an hourly, daily, weekly, monthly, etc. basis.
This depends on the time horizon of our analysis. Those who follow short-term strategies generally opt for the hourly or daily time frame. On the other hand, those seeking a broader analysis tend to use the monthly or weekly time frame.
There are different moving averages, each of which has a specific calculation formula.
Types of Moving Averages
There are three main types of moving averages:
- Simple Moving Average
- Weighted Moving Average
- Exponential Moving Average
Let’s look at them in detail.
Simple Moving Average (SMA)
The SMA is the easiest moving average to calculate. It is a simple arithmetic average obtained by summing the prices of n periods and dividing the result by the total number of records.
This type of averaging is very popular, mainly because it’s very easy to calculate. However, the biggest problem with the simple moving average is that in the mathematical formula, all inputs in the series have “equal weight.”
This means that the most remote data in the series has the same relevance as the most recent data.
For example, for a 10-day SMA, each value weighs 10% of the total. This problem is solved by the formula for the weighted average formula.
Weighted Moving Average (WMA)
The WMA is an arithmetic average of the price, with the most recent values carrying more weight than the more remote values in the series.
For example, in a 20-day WMA, the most recent value is multiplied by 20, the previous day’s value by 19, and so on. The total is then divided by the sum of the products. This produces an average value that is much more responsive to recent prices and trends.
Exponential Moving Average (EMA)
The EMA is a more complex type of average that, like the WMA, assigns different weights to past data. The main difference between the WMA and the EMA is that the latter considers all values in the historical data series of a price, with decreasing weighting being exponential rather than ordinal.
This means that more remote values are progressively weighted infinitesimally. Precisely because of its complexity, the EMA is generally used only by the most experienced traders.
Which Moving Average to Choose: SMA, WMA, or EMA?
As we have seen, each type of moving average has different characteristics, settings, and pros/cons.
Therefore, the choice depends on the particular trading strategy’s operational needs and time horizon.
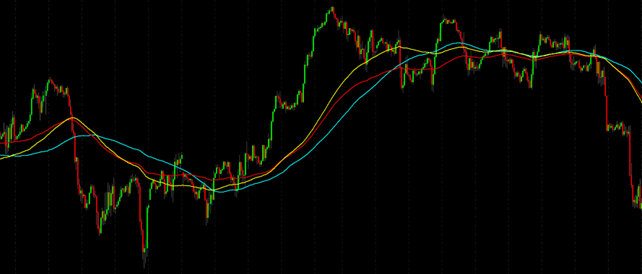
The following chart shows the trend of the three moving averages (200 periods) for Crude Oil price.
The blue line represents the SMA, the blue the WMA, and the red the EMA.
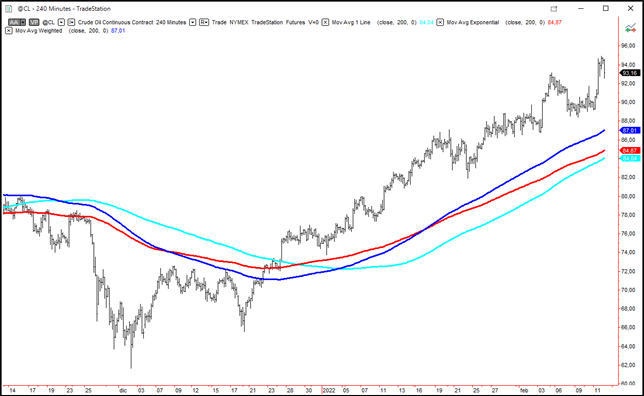
As can be seen, SMA tends to adjust more slowly, especially compared to WMA.
How to Set the Period in Moving Averages
The period expresses the number of candlesticks over which the moving average is measured. For example, for a 20-period moving average, the data of the last 20 candlesticks are taken into account.
It’s possible to set a moving average over three main periods:
- Short period: generally includes 5, 10, or 20 periods.
- Medium period: covers a time frame from 50 to 80 periods.
- Long term: 100 to 300 periods.
Moving averages of different periods are often crossed to provide operational cues and entry/exit signals.
Why Use Moving Averages in Systematic Trading?
Moving averages are used for three main reasons:
- As trading signals to identify selling or buying opportunities
- As trend indicators to analyze the performance of a financial instrument
- To construct other technical indicators, such as Bollinger Bands, whose center line is represented precisely by a SMA.
Moving averages can also be used with a support or resistance function. It is possible to select a moving average and trade on its breakout or, in the case of trend-following strategies, on its hold, just as one does with price lines.
For the sake of brevity, we’ll focus on the first two functions in this article.
Using Moving Averages as Signals
Moving averages can be used to obtain long or short entry signals.
This can be done in two ways:
- Crossing moving averages/price
- Crossing two or more moving averages.
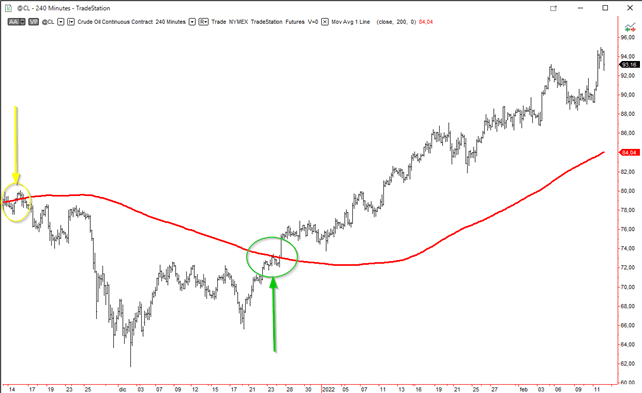
In the first case, if the price line crosses upward with the moving average within the given time frame, there is a potentially long entry signal.
In the opposite case, however, there is a short entry signal.
Of course, by changing the time horizon, the signals can also vary.
The second strategy, on the other hand, is to cross two or more moving averages.
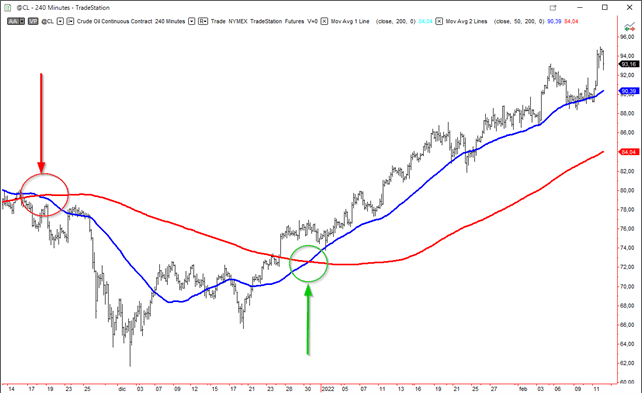
In general, there is a tendency to mix a “slow” moving average, such as a 200-day moving average, with a “faster” moving average, such as a 50-day moving average.
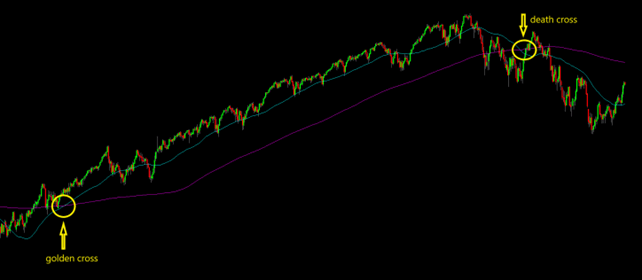
In this case, if the fast-moving average crosses upward with the slower-moving average, there is a bullish signal (the so-called “golden cross“).
Conversely, if it crosses downward, the indicator is bearish (the so-called “death cross“).
Use of Moving Averages as Trend Indicators
Long-term moving averages, especially 200- or 300-day moving averages, are often used to monitor market trends.
The use, in this case, is particularly suitable for trend-following strategies. The main problem is that signals can only be caught with an inevitable delay.
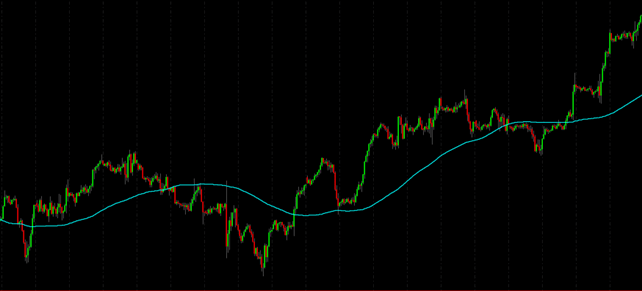
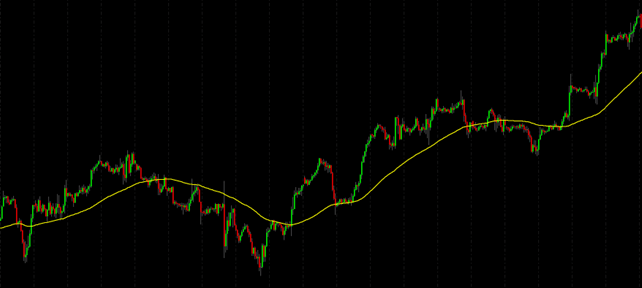
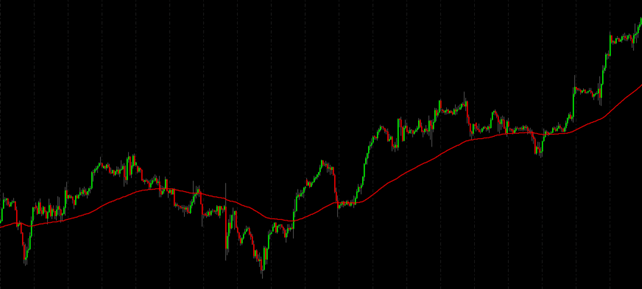
In the following video, we’ll show you two kinds of moving averages using Heating Oil as a reference. You’ll find some interesting trading tips for creating a solid system based on moving averages. Don’t miss it!
Conclusions
Moving averages are among the most commonly used indicators in trading. There are three main types, each of which has different features, functions, and settings.
Moving averages can be used in trading primarily as trading signals or trend indicators. They can also identify support or resistance areas or create other technical indicators, such as for Bollinger Bands.
In systematic trading, moving averages, like all indicators, should generally be used with time frames greater than or equal to 30 minutes to avoid market background noise and, thus, excessive generation of signals that are difficult to filter.