The RSI indicator (Relative Strength Index) was created by John Welles Wilder in the 1970s. Most often, it is used by futures traders and can be particularly useful for measuring the strength of price movements.
The RSI falls into the “oscillator” category of indicators and lets you evaluate the strength of a market using a scale of values ranging from 0 to 100. A higher value corresponds to a stronger market and a lower value corresponds to a weaker market.
These values are used to identify overbought and oversold situations useful for generating long or short entry signals.
In this article, you will find a simple, user-friendly guide to the RSI indicator, from how to build it to how to interpret and use it in a trading strategy.
How to Build the RSI Indicator
If you are not familiar with the RSI indicator, we recommend that you first watch the video below, in which one of our coaches explains clearly and thoroughly how to build this indicator:
If you had difficulty following the various on-screen steps, below we offer a brief step-by-step explanation. If you have it all figured out, you can move on to the next section.
Step #1: Up Close and Down Close
As explained in the video, to build the RSI indicator we need two sets of values: the Up Close and the Down Close of the last n periods.
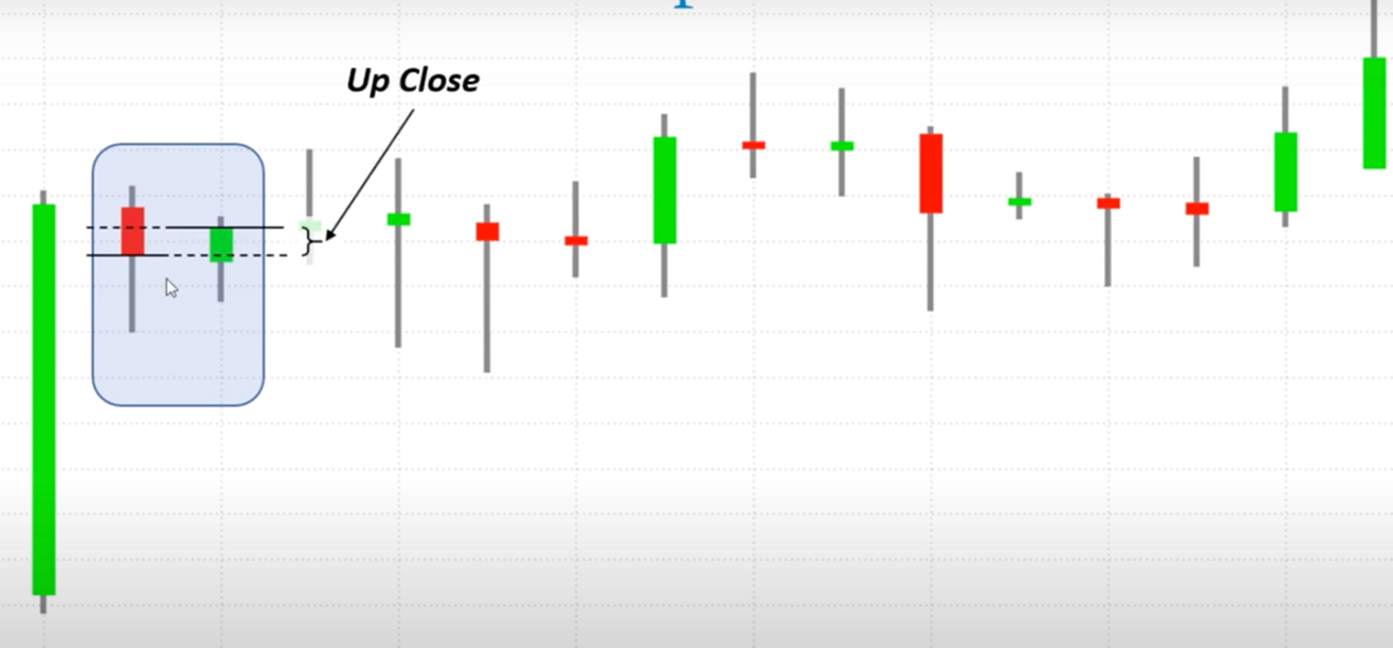 Example of an Up Close on a daily time frame: the Close of today’s bar is higher than yesterday’s Close.
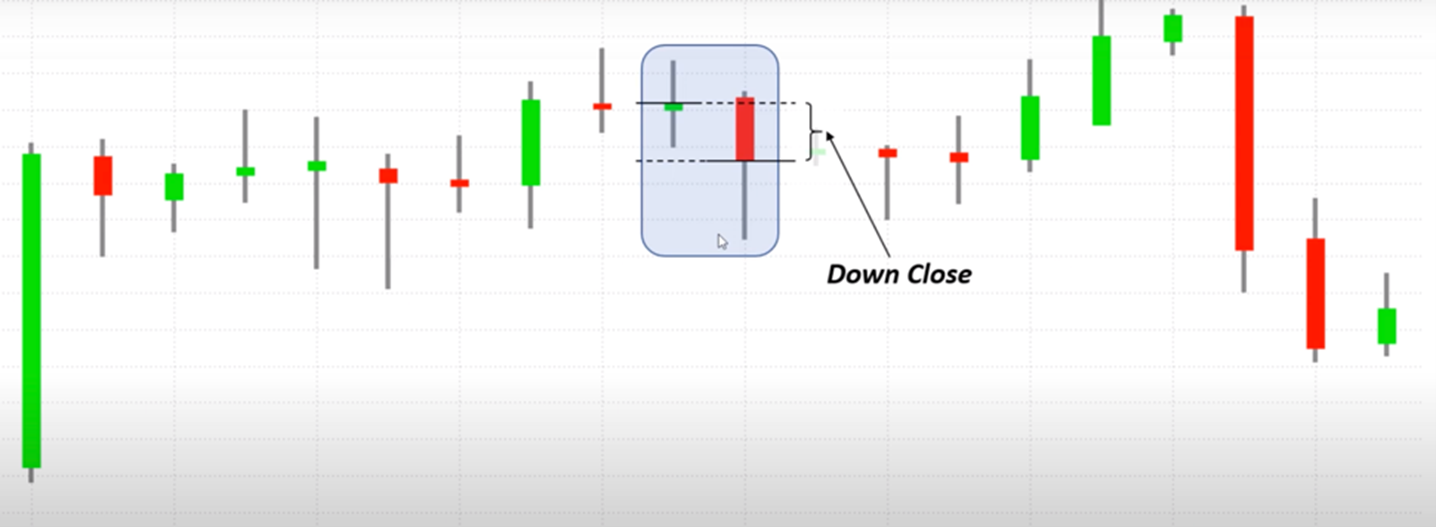 Example of a Down Close on a daily time frame: today’s Close is lower than yesterday’s Close.
Regarding the time horizon, traditionally 14 daily bars are considered (although to streamline the explanation, in the above video we considered only the last 7 bars) and the values of the Up Close and Down Close are recorded:
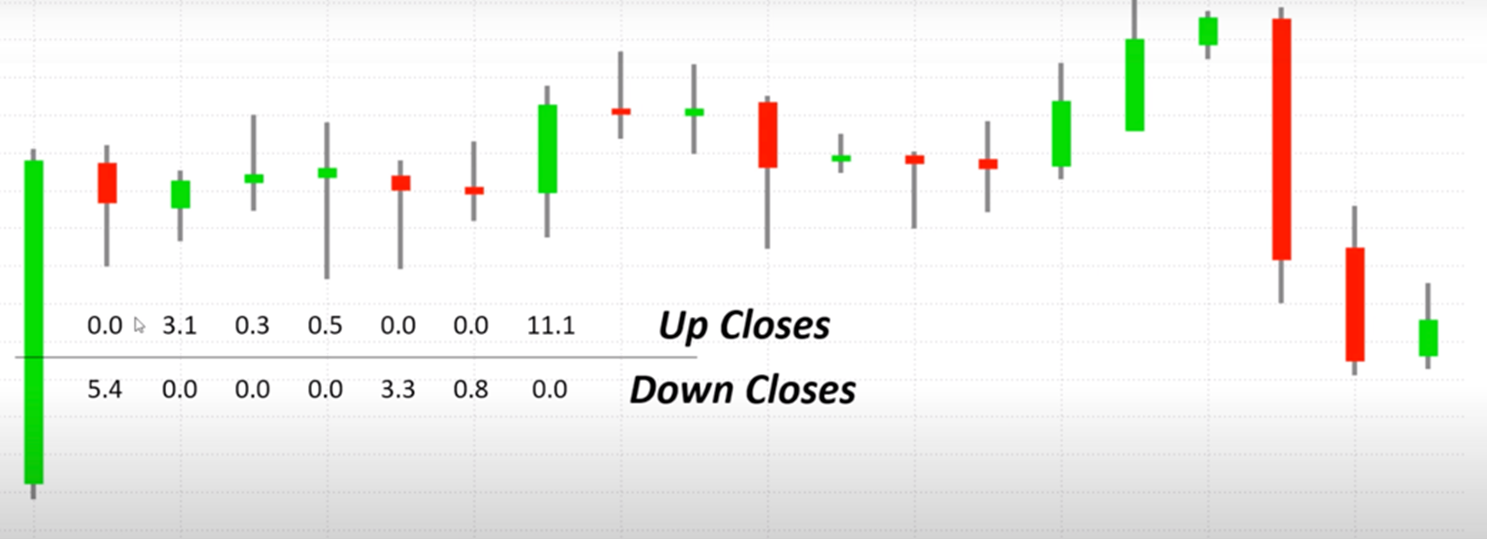 Up Close and Down Close values of 7 daily bars.
Step #2: Calculating the Relative Strength
The Up Close and Down Close values are used to calculate the Relative Strength (RS) of the market.
The RS is simply defined as the ratio of the sum of Up Closes to the sum of Down Closes. In other words, just add up all the Up Closes, add up all the Down Closes, and divide the first number by the second:
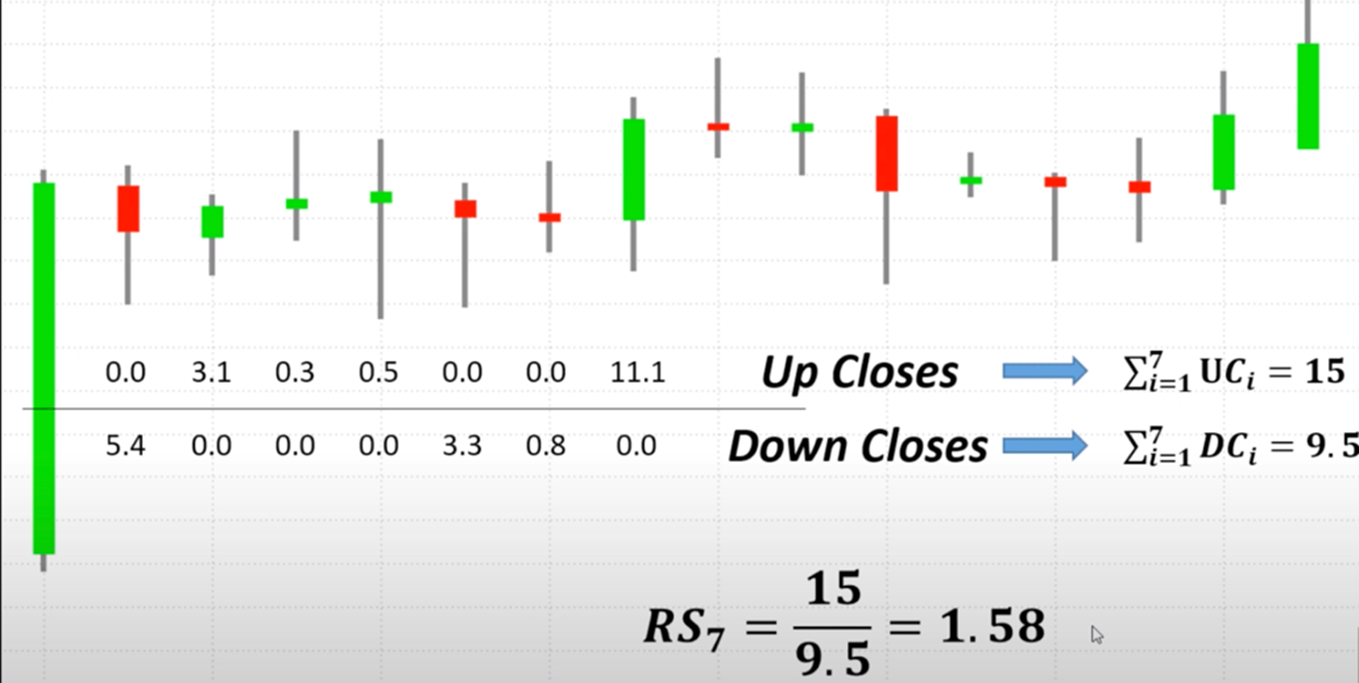 Calculation of the RS.
Step #3: Calculation of the RSI
All that is left to do at this point is to transform the Relative Strength into an index on a 1-100 scale using the following formula:
RSI=100−1001+RSRSI=100−1001+RS
How to Interpret the RSI Indicator
As you can see, calculating the RSI is not all that complicated, but why should you use it in your strategies?
As mentioned at the beginning of this article, the RSI allows you to make assessments regarding the strength of a market’s trends by identifying overbought and oversold situations.
To identify these situations, you just need to compare the RSI value with some predefined thresholds:
-
RSI values greater than 70 indicate an overbought situation (you can also use 80 as a threshold, which offers more accurate but less frequent signals)
-
RSI values less than 30 indicate an oversold situation (20 can also be used as a threshold, for more accurate but less frequent signals).
Of course, it should be kept in mind that the RSI values obtained also depend on the parameters used to calculate the indicator. Following the directions of Welles Wilder, the creator of this oscillator, the default parameters for calculating the RSI are the following: 14 periods, with a daily time frame, using the Up Closes and Down Closes as data sets.
However, at your discretion, you can use more or fewer reference periods and different sets of values such as the Opens, Highs, or Lows.
How to Use the RSI in a Trading Strategy
The RSI is one of the best-known indicators in technical analysis; it is commonly used to identify the right times to send buy or sell orders.
In systematic trading, this indicator can be inserted in trading systems either as a trigger, that is, to generate buy and sell signals, or as a filter.
In the video below, one of our coaches explains how to use the RSI in both ways and compares the performance, backtest results and equity lines of the two trading systems thus obtained:
As shown in the video, the RSI offers no particular advantages when used as a trigger. However, its use as a trading filter can produce excellent performance, especially after optimizing the threshold values to further filter out entry orders.
Conclusion
We hope that this article was helpful to you!
If you want to learn more about how to use indicators in trading systems, please check out the other articles on our blog.