The Breakout Channel, or price channel indicator, is one of the best-known and longest-lived indicators. Indeed, this indicator has been thriving in the commodity market since the 1950’s.
The gradual decrease in the volatility of commodities since 2000 lead to a decrease in the applicability of the Breakout Channel to this specific financial sector. However, as we’ll see in detail in a moment, the Breakout Channel found new life in the cryptocurrency market, which now shows volatility comparable to commodities in the last century.
In this article we will define the Breakout Channel, learn to use it in a trading system, and analyze a specific application in the Crypto market.
Breakout Channel Definition
The Breakout Channel defines a price channel and provides entry signals when prices break this channel.
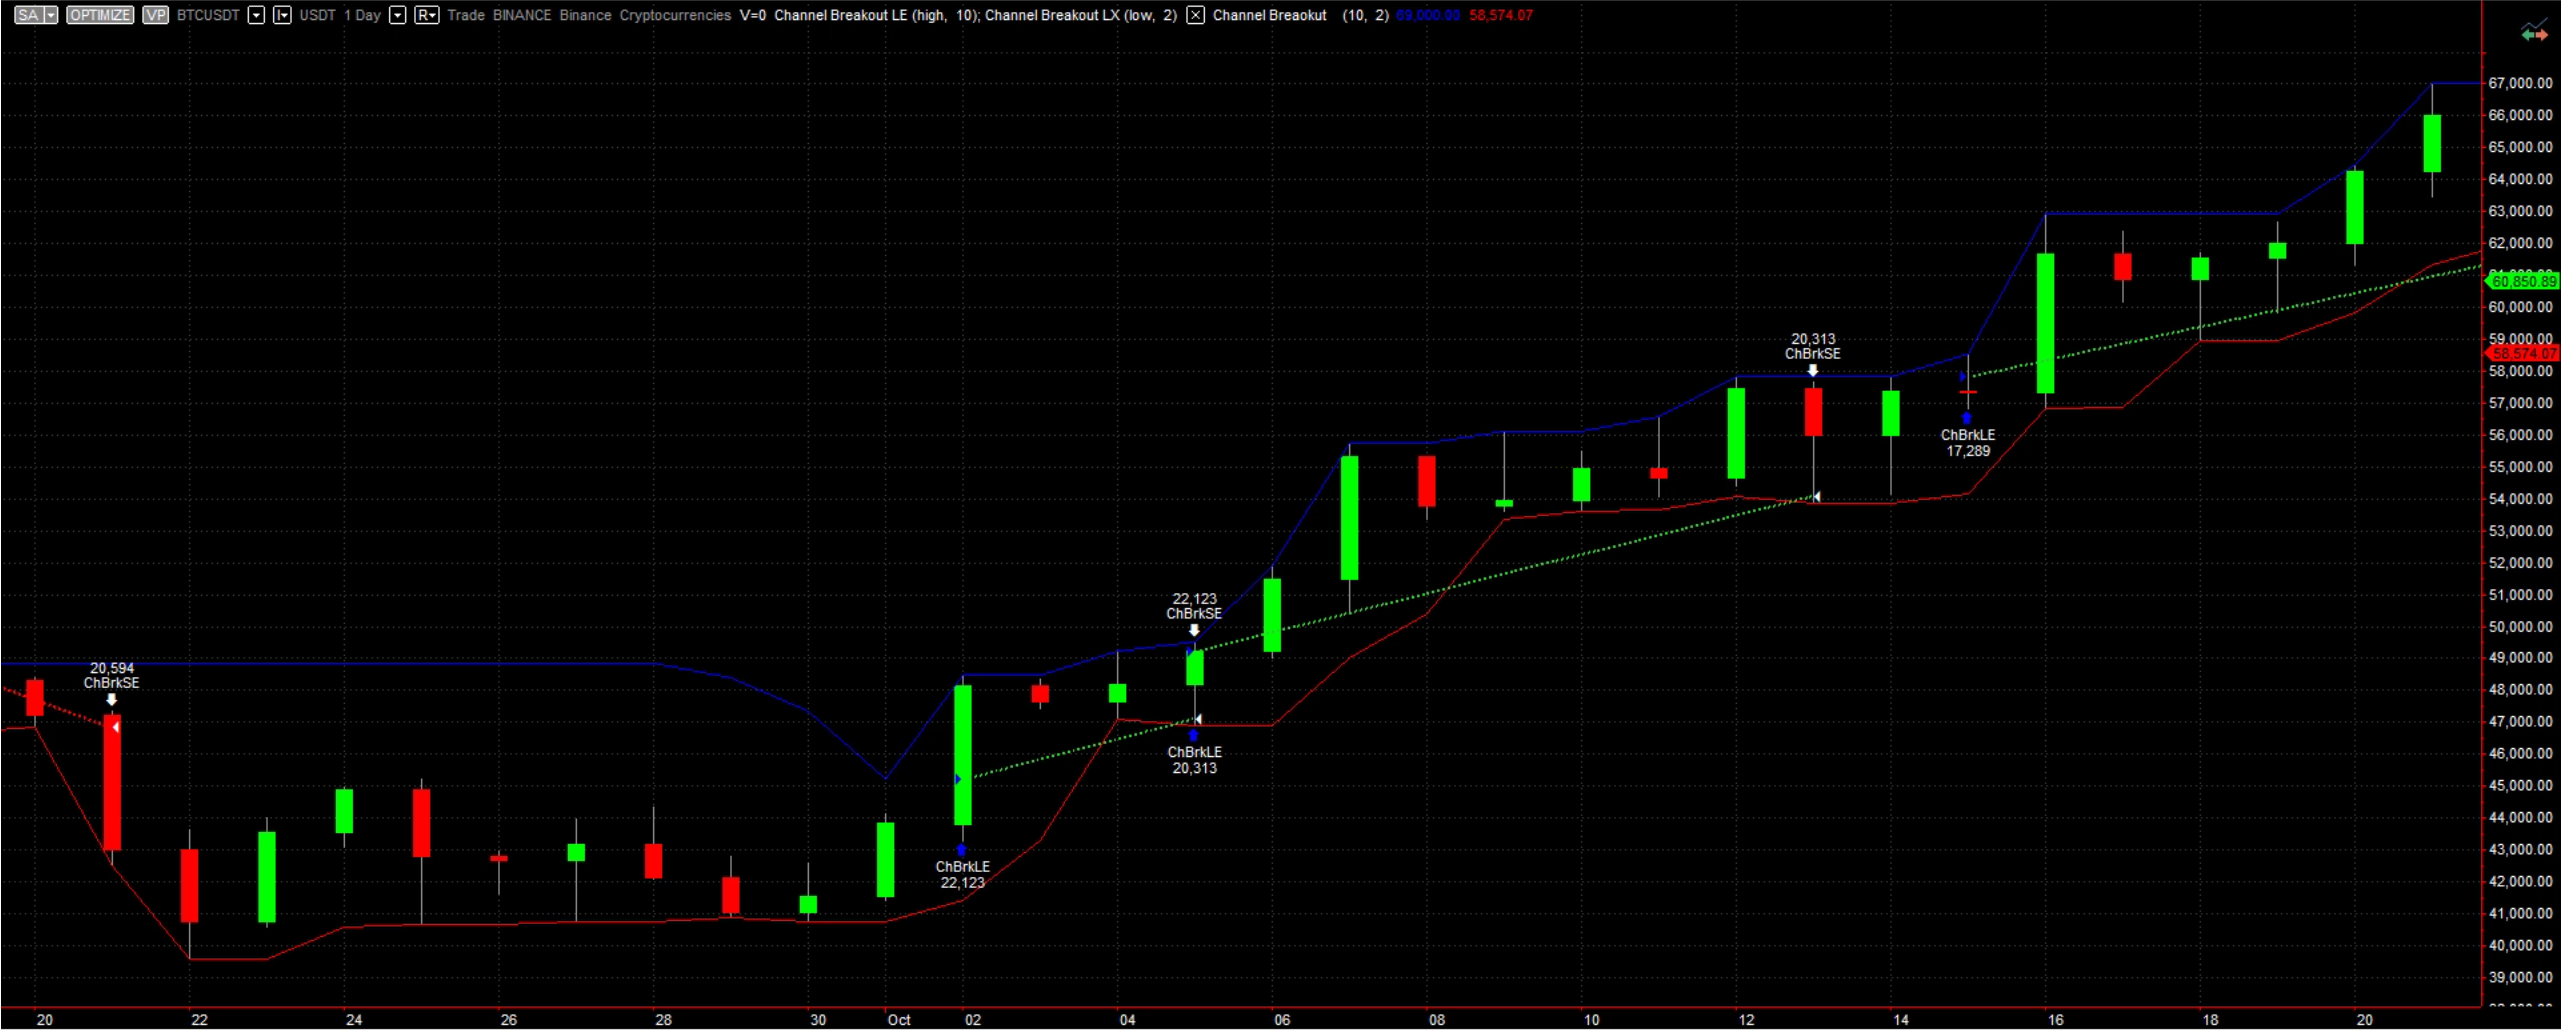
In the image below you can see an example of a Breakout Channel. This is a very simple indicator, consisting of just two lines.
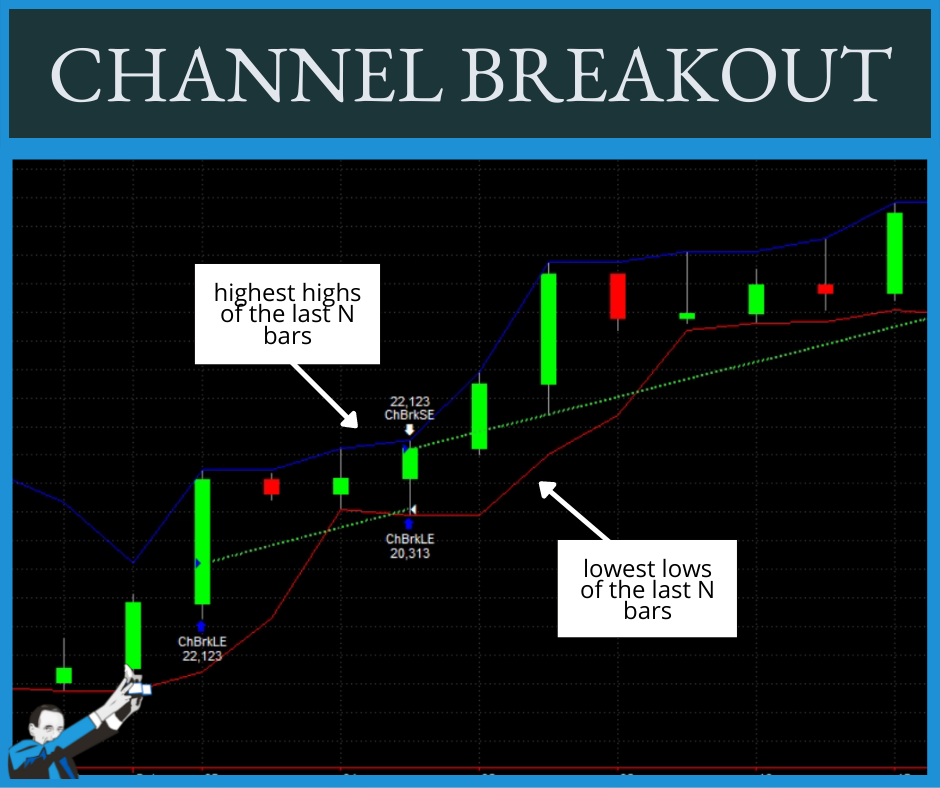
The upper line plots the highest highs of the last 10 bars, while the lower line plots the lowest lows of the last 2 bars.
This means that the upper (blue) band grows as the price of the underlying asset rises, plotting the highest high of the last 10 bars, while the lower (red) band tracks the lowest low of the last 2 bars.
Both the upper and lower lines follow the price trend, but since the line of lows has a shorter reference period, it tends to be more closely fitted to the bars.
How to Interpret the Breakout Channel
As mentioned, the purpose of this indicator is to provide signals when the prices of an underlying asset cross the lines of the identified price channel.
In the example shown in the image above, long entries occur whenever the price breaks the highest high of the last ten bars. Positions thus opened close when, over the course of the day, the price breaks the lowest low of the last two bars.
We’re referring to the daily time frame because we are using daily bars in this example, but the same concept can also be applied to different time frames.
As you can see, the operation of the Price Channel is very simple. It’s considered one of the most intuitive and easy-to-use indicators.
By the way, this indicator is also present in the form of a pre-coded trading system within the code library of MultiCharts. Those using this platform can then start with the signal already coded without the need to program the indicator from scratch (if you want to learn more about programming for systematic trading check out this article).
How to Use the Breakout Channel in Systematic Trading
As mentioned, after 2000 the Breakout Channel lost its effectiveness in commodities, the market for which it was created. Does this mean that this indicator is no longer useful for trading today?
Absolutely not! As we’ll explain in the video below, today there is a market that has very similar characteristics to commodities before 2000: cryptocurrencies.
Thanks to their high volatility, these instruments can be traded with strategies using this indicator.
In the video, you’ll find a practical example of how the Breakout Channel can produce very interesting results, both when applied to a single cryptocurrency and when applied to a portfolio of 25 cryptos.
Application of the Breakout Channel to Crypto
As we showed in the video, the system operates only long, since cryptos are generally characterized by an underlying bullish trend.
One might instinctively think that this approach is problematic, especially at times of significant decline. In reality, the results are very positive. Below is a freeze-frame from the video showing the equity line produced by backtesting the system shown in the video on a portfolio of 25 cryptocurrencies.
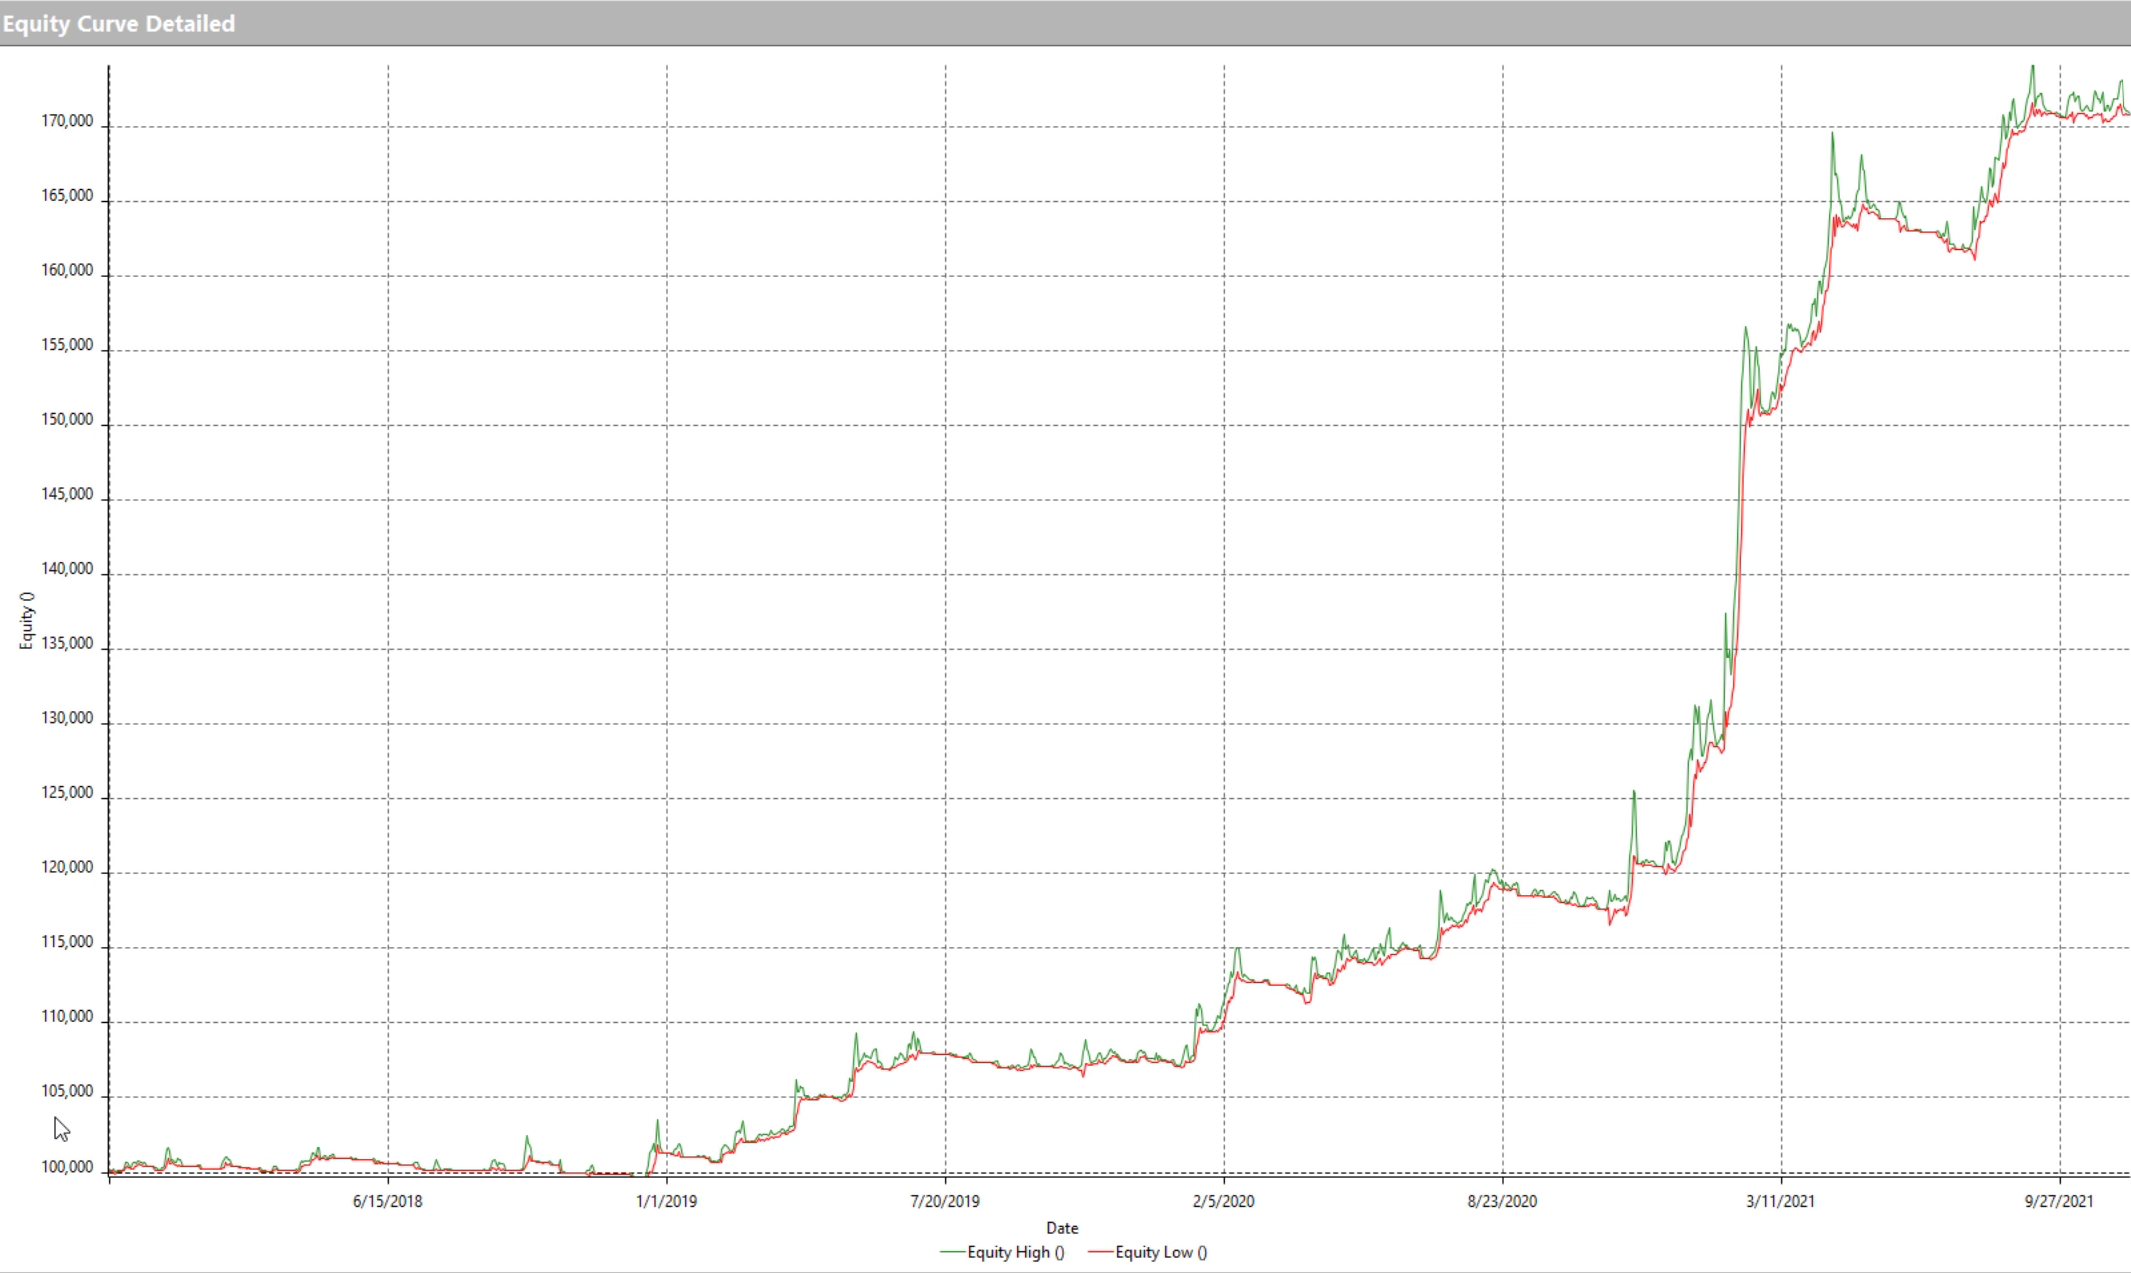
What makes this result particularly interesting is not only the positive trend of the equity line but also the fact that the backtest includes a negative market phase from 2017 through 2019.
In that negative market time frame, you can see how the equity line moved sideways. Considering that the drawdown during that period was about 80%, we can say that the system worked very well.
So, it seems that operating only long on crypto using systems based on the Breakout Channel can help us ride the bullish trends in this market by limiting the impact of drawdown in the downswings.
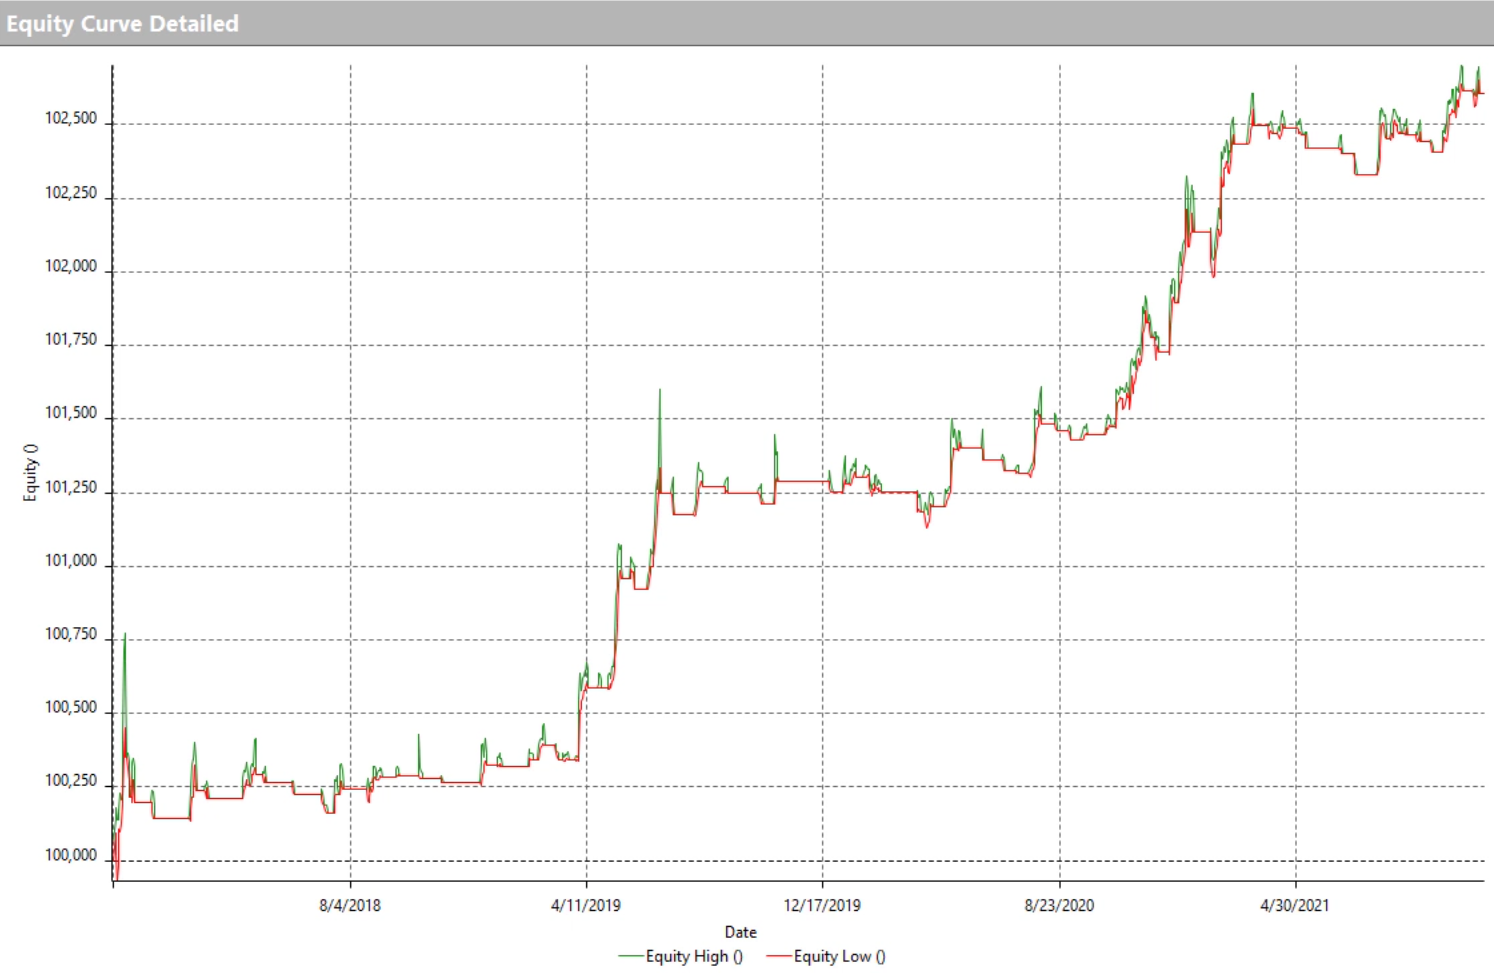
The same happens on Bitcoin as well. Below you can see the equity line produced by the system when we tested it on Bitcoin’s historical data.
Finally, one last note on the parameters used to create the price channel. In our example, we consider 10 bars for the upper line of the highest highs and 2 bars for the lower line of the lowest lows.
These values aren’t taken at random but are the result of optimization, as explained in the video starting at 6:45.
Conclusion
Although the Breakout Channel was created more than 60 years ago, it’s still a valuable instrument for very volatile markets.
In this article we considered a strategy in the cryptocurrency market, both on a single coin (Bitcoin) and a portfolio of 25 different cryptocurrencies. In both cases, the results were positive, despite market drawdowns.
Also, you may have noticed that the system was applied to cash cryptocurrencies, not futures. These show that it’s possible to achieve excellent results with cryptos even without using futures.
If you’re interested in learning more about systematic trading applied to cryptocurrencies, don’t miss our free webinar prepared by one of the coaches at Unger Academy! Click here to watch!