Drawdown is one of the most useful instruments for evaluating the performance of a trading strategy or portfolio. Together with the total net profit and the average profit per trade (Average trade), this value is critical to evaluate the performance of a strategy or portfolio.
Drawdown is also a very important risk assessment instrument. High drawdown values can arise from a risk profile that is too high and therefore a potentially risky approach.
In this article, we’ll explain what exactly drawdown is and how to interpret this metric when analyzing the performance of a strategy or portfolio to understand whether you are managing risk and capital correctly.
Not only that! Since drawdown can be limited through various techniques, we’ll outline some useful approaches to help you concretely reduce this metric and improve the performance of your strategies.
What Is a Drawdown?
Maximum drawdown (Max DD) corresponds to the maximum negative movement of a strategy within a period, where maximum negative movement means the difference between the highest peak and the lowest peak touched by the profit curve of a strategy or portfolio.
Depending on the values used to calculate the profit curve, different types of drawdowns can occur:
-
Maximum Detailed Drawdown: maximum negative movement calculated using the values of open positions at the close of each bar in the period under consideration
-
Maximum Intraday Drawdown: maximum negative equity movement calculated on a given trading day.
-
Close-to-Close Drawdown: maximum negative equity movement calculated at closed trades.
Maximum drawdown gives a dimension of the risk of a particular strategy. For this reason, it’s a popular metric for evaluating strategy performance.
In addition, drawdown can be measured either in absolute monetary terms or in percentage terms. The difference between these two methods is simply that in the first case, the drawdown value will be calculated in absolute terms, while in the second case, it will be calculated as a percentage of the initial capital set at the start.
Normally, absolute drawdown is preferrable when trading Futures, and percentages are better suited to stocks or ETFs.
Why Is Drawdown So Important?
The maximum drawdown of a strategy or portfolio is critical in evaluating its performance. Unlike net profit, which tells us how much was gained or lost in a given period, drawdown reveals how efficiently that result was achieved.
Imagine two strategies:
-
a first strategy which made a profit of $50,000 in 1 year with a maximum drawdown of $10,000 (20%)
-
a second strategy which made the same profit in 1 year but with a maximum drawdown of $5,000 (10%)
Which strategy do you think is the most efficient? Undoubtedly the second one, since the maximum losses incurred throughout the year were half the amount.
These considerations, which we’ve simplified here, are vital to determine if your risk profile is appropriate.
In a sense, you can think of a strategy’s drawdown as a thermometer that allows us to measure its “well-being”: the higher the drawdown values, the greater the risks to the well-being of our strategy.
Fortunately, by interpreting drawdown values correctly and taking measures to limit their magnitude, we can improve our strategy’s overall robustness and performance.
How to Interpret Drawdown Data to Understand Whether a Strategy Is Efficient or Not
A correct interpretation of drawdown data is a key step in evaluating the performance of a strategy. This applies to actual strategy performance as well as backtests.
Real Performance
As far as actual performance is concerned, there isn’t much to say. Inside the reports made available by the broker, we usually also find calculated percentages related to drawdown.
These percentages refer to the maximum negative excursion of our trading account during the reporting period and help us to assess whether the risk profile we’ve adopted is more or less effective.
If the drawdown percentage of your portfolio is very small, indicatively under 10%, your strategies are incurring small losses overall. Therefore, you’re managing risk correctly.
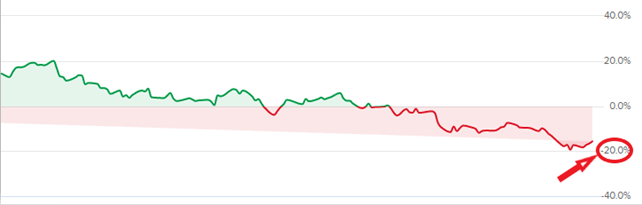
Conversely, very high percentages above 30%, reveal substantial losses that indicate poor risk management, probably due to overexposure (too much capital invested in each trade) or lack of diversification (too many strategies in related markets moving in the same direction can produce large losses at the same time).
Backtest and Optimization
The backtest is nothing more than a simulation of all the trades that a strategy would have executed in the past. The results of this simulation include data useful for evaluating the effectiveness of a strategy. As already mentioned, the most important values are Net profit, Average trade, and Drawdown.
In this context, drawdown helps us get an idea of how the strategy will perform in the future:
-
1. The absolute maximum drawdown touched gives us an indication of the worst-case scenario we could face. Indeed, some formulas calculate the Worst-Case Scenario starting precisely from the maximum drawdown.
-
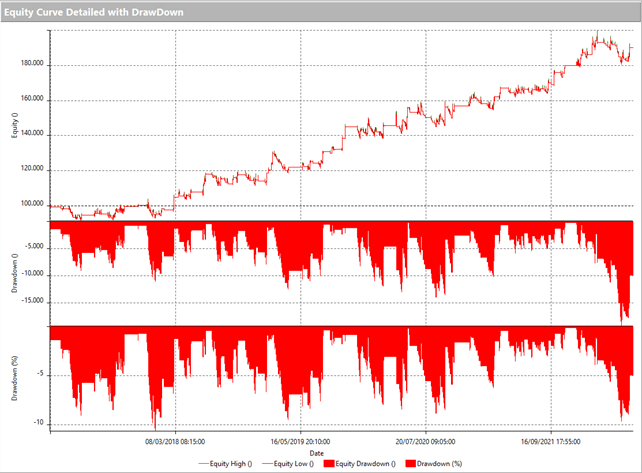
2. By examining the evolution of drawdown (expressed in monetary terms) over different periods, we can identify the market phases in which the strategy would have performed better or worse (bullish, bearish, sideways, volatile, etc.)
In this case, there are no objective benchmarks for determining whether the drawdown of a strategy or portfolio is too high.
However, there are some parameters that we can consider.
The first parameter is net profit. Drawdown should always be assessed in relation to the profits made by a strategy or portfolio.
The second parameter is the characteristics of the market you are trading in. Not all markets have the same characteristics in terms of liquidity, capitalization, and volatility. For example, it’s logical to expect larger drawdowns on heavy markets, such as the DAX, given the larger account excursion due to asset movements. In contrast, on smaller and lighter markets, such as Lean Hogs, acceptable drawdown values (in absolute terms) should be lower.
How to Limit a Strategy’s Drawdown
Should you find yourself dealing with extremely high values when analyzing the drawdown of a strategy, don’t despair. A high drawdown doesn’t necessarily mean that the strategy in question is doomed.
As explained earlier, drawdown is closely related to risk management. This means that if you want to limit this metric, you’ll have to work on certain aspects that directly affect the chosen risk profile.
In this regard you can focus on two key elements:
-
1. Money Management
Position sizing, or the portion of capital you decide to invest in each trade, has a strong impact on drawdown. To reduce this metric, we advise you to be careful not to overexpose (for example by investing too much money in individual trades) and to avoid overly risky position-sizing models. -
2. Position management (exits)
Every strategy should contain instructions for closing positions. Usually, when it comes to exits, thoughts turn to stop loss, or a stop order that closes positions upon reaching a predetermined loss limit. Therefore, we advise you to check that the strategy contains a stop loss and that its value matches the market in which you’re trading.
If you don’t want to use stop loss, please be reminded that there are other types of exits: time exit, stop and reverse, trailing stop, breakeven stop, etc.
Another approach to limit the drawdown amount is to filter the trades made by a strategy. One method is to use price patterns, which are very important in the Unger MethodTM because they identify the best conditions to buy or sell a particular asset.
As mentioned earlier, the analysis of drawdown values helps us identify the conditions under which a strategy would have experienced the greatest losses.
Based on these considerations, we can try to limit drawdowns by preventing the strategy from opening positions under the conditions when the worst drawdowns were recorded.
Here are two useful filtering approaches for limiting drawdowns:
-
Filtering Long/Short trades
You can compare the equity line produced by only long (buy) and short (sell) trades in your trading platform. If you notice that only one of these two curves has very high drawdowns, you can try to prevent the strategy from opening such positions. -
Filtering trades based on time parameters
If, when analyzing the drawdown results of your strategy, you notice recurring patterns related to the time of day, day of the week, or time of month or year, you can try to limit trades by using time windows or by converting the strategy to a “bias” strategy that determines when to trade based on statistical behaviors of the market.
User Guidelines: What to Watch Out For When Filtering Drawdowns
By applying filters to your trades, you can improve the performance of your systems. At this point, the temptation might be to add more and more restrictive filters until you almost completely remove drawdowns from your backtests.
Unfortunately, operations of this kind fall into the territory of the much-feared overfitting, or over-optimization of strategies.
When you add filters, you create conditions based on the strategy’s performance on historical market data. These conditions depend on what has happened in the past, so the more restrictive they are, the more they risk not applying to the future since the market is unlikely to behave the same way again.
Another issue related to the excessive use of filters is their use in strategies that have already been optimized.
If you’ve just optimized a strategy by selecting the parameters that produce the best performance, it wouldn’t make sense to go and add additional filters to change its performance.
Conclusion
This article, which we trust you found useful and interesting in its entirety, hopefully provided you with a complete picture of how to interpret and manage the drawdowns of your strategies and portfolio.
As you can see, a drawdown is a critically important metric. Indeed, the information it provides can help us improve the performance of our strategies, better manage risk, and build more stable and solid strategies.