In this article, we are going to look at what Bollinger Bands are, how to calculate them, what kinds of strategies they are used in, and what kind of results we can expect by using the Bollinger Bands in systematic trading.
Theory and History of the Bollinger Bands
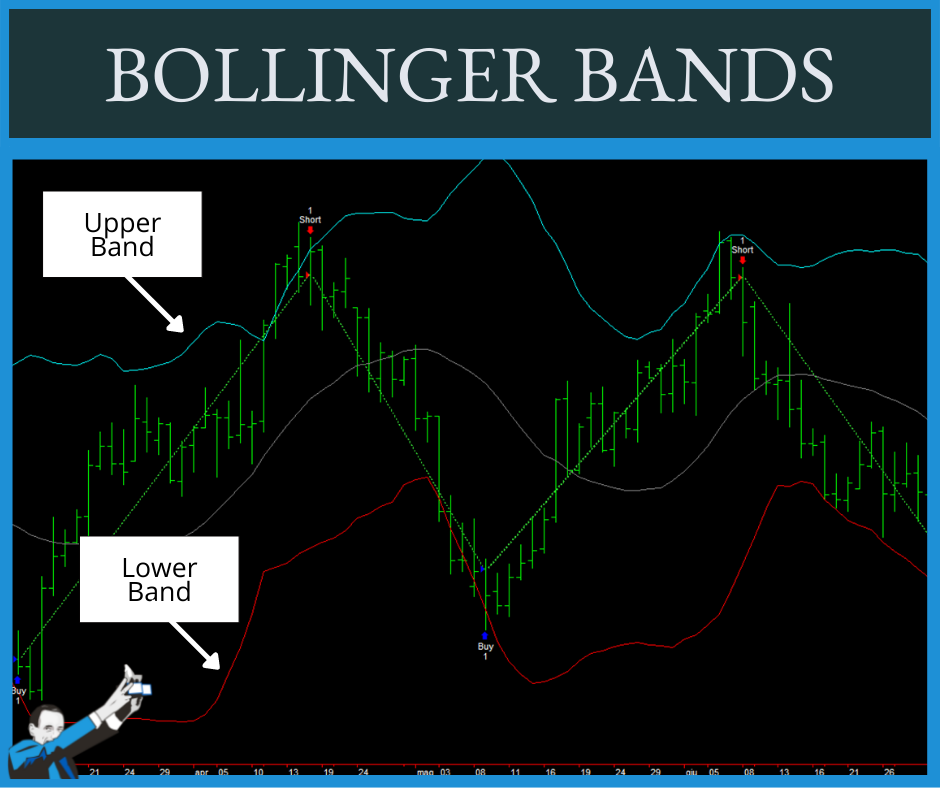
The Bollinger Bands are a technical analysis indicator composed of some trend lines that are drawn at two standard deviations (either positive or negative) from the simple moving average of an asset’s price.
Essentially, the Bollinger Bands are a volatility indicator that measures the highs and lows of an asset’s price compared to the previous movement of the price.
The standard deviation (or mean square deviation) is used to measure the average volatility of the market. It is a dispersion index that encloses certain data within it, which, when applied to trading, coincides with the market prices. The Bollinger Bands are usually calculated over 20 periods using two standard deviations. As volatility increases, these bands tend to widen, while under low volatility conditions, the distance between them decreases.
The Bollinger Bands were developed by John Bollinger. They were initially intended for stock trading. However, over the years they have proven to be effective in other financial markets such as Forex.
The Bollinger Bands are used to generate long and short market entry signals based on the price movements of an underlying asset.
How to Calculate the Bollinger Bands
To build the Bollinger Bands, you must first calculate the simple moving average (SMA) of the financial instrument. Usually, we calculate the SMA over the last 20 days. The SMA can be calculated by dividing the sum of the closing prices by the number of periods considered.
The two bands, upper and lower, are then corrected by multiplying the standard deviation by two. The standard deviation measures the volatility that determines the range of the data. Using the second standard deviation, it is estimated that about 95% of the closing prices will be within the Bollinger Bands.
For this reason, whenever the price is trading above the Upper Band, we say that the asset is overbought compared to its recent price behavior.
Conversely, if the price is trading below the Lower Band, then the asset is said to be oversold. When these conditions occur, it is reasonable to expect prices to return toward their mean.
Systematic Trading Strategies Based on the Bollinger Bands
The Bollinger Bands can help us identify overbought and oversold levels. This information is quite versatile in systematic trading. In the video below, one of our coaches shows a practical application.
In detail, he explains how to build a reversal strategy, that is, a strategy that takes advantage of the mean-reverting behavior of the market, or the tendency of prices to return toward an average value. If you want to skip the theoretical introduction, start watching the video from minute 3:25.
In the script used by our coach in the video, we see that the system waits for the market to close above the Lower Band to open a long position (i.e., to buy). Conversely, to open a short trade (i.e., to sell), the system waits for the market to close below the Upper Band following an exit above the Bollinger Bands and then a re-entry within them.
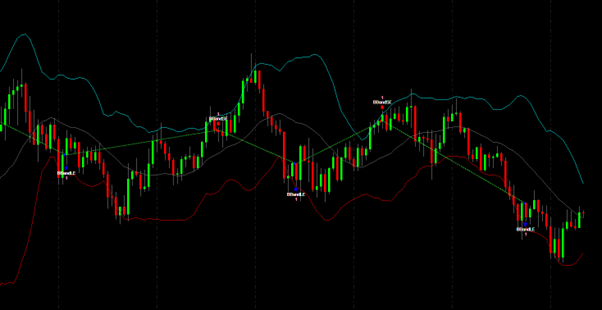
Example of a reversal pattern on the Bollinger Bands.
At first glance, the results look very good. However, on closer inspection, a less exciting reality emerges. However, by adopting the Unger MethodTM and applying the correct filters, the results improve dramatically, as you can see from minute 10:50 of the video.
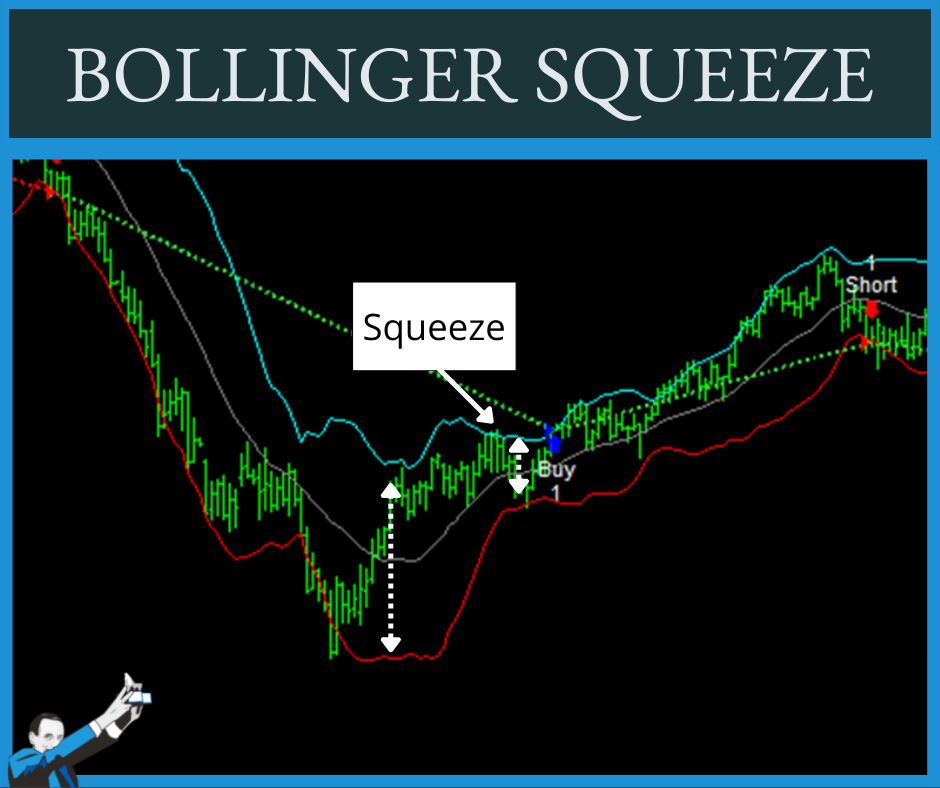
Another Strategy: The Bollinger Band Squeeze
Bollinger Bands can also be used to monitor the typical alternation between compression and explosion phases of volatility.
The so-called “Bollinger squeeze” is a strategy that generates entry signals based on the distance between the Lower and Upper bands.
When the two bands widen there is a volatility expansion. When they narrow (and this is where the “squeeze” occurs) there is a volatility compression. Since a compression phase is usually followed by an explosion, the strategy generates long or short entry signals at certain levels.
The reasoning behind this approach is that in phases of volatility explosion, market movements are larger and stronger and, consequently, easier to ride.
Below is a chart of the EUR/USD forex pair where you can see two examples of squeeze opportunities. To use this strategy effectively, you should enter long positions when the prices rise above the Upper Bollinger Band and open short positions when the prices fall below the Lower Band.
Using the Bollinger Bands as Triggers for the Exits
Sometimes traders tend to focus on the right time to enter and forget that profits and losses are realized when a position is closed.
Because it is often difficult to identify the best time to close a position (partly for emotional reasons), a good rule of thumb is to plan the exits so that they are as easy to execute as possible.
Bollinger Bands can help in this respect. In fact, we can exploit them to more easily monitor the behavior of a price, adjusting our positions accordingly.
Conclusion
The Bollinger Bands can be a great tool in the arsenal of us systematic traders. Like all indicators, they should not be mistaken for a magic wand that can work under all circumstances, but recognized as a valuable aid to shed some light on market behavior.
In this article, we have explored the possibility of improving the performance of some strategies using the Bollinger Bands, for example, by applying the correct filters of the Unger MethodTM presented in the video.
If you want to learn more about the Bollinger Bands, you can read this article in which we discuss the Bollinger Bandwidth, an indicator that is used to measure the width of the Bollinger Bands to identify new highs and lows more easily.