Supports and resistances are among the basic concepts every novice trader should master. They are easy to understand, and most traders come across them quickly.
The real question is, do supports and resistances provide added value to our trading activity? In this article, we’ll try to better understand what they are, how they are used, and whether they can be effectively applied to systematic trading.
What Are Supports and Resistances?
Supports and resistances are lines drawn on charts to indicate those levels where prices stop and continue in the opposite direction.
A support is the level where a price stops a downward movement and then begins to rise again. Resistance, on the other hand, is the level where a price stops an upward movement and then begins to fall.
These points are viewed as moments of strength or weakness in the market and should, in theory, help the trader pinpoint the right time to ride this bullish or bearish trend.
The basic theory behind supports and resistances is that price levels are the result of excess supply or demand. A support level is a price level resulting from excess of demand, which means that more people are buying than selling. Because so many people want to buy, the price is pushed upward away from the support level.
Conversely, at a resistance level, the number of people selling is greater than the number of people buying, and this drives the price down.
Lastly, there are three different types of supports and resistances:
- Fixed levels: These levels change only when the price crosses them; in any other case they are not affected by price fluctuations.
- Dynamic levels: These levels are recalculated whenever a price reaches a certain point.
- Semi-dynamic levels: Levels are recalculated. Compared with dynamic levels, however, levels change at a fixed rate. They are therefore a kind of “fixed changes.”
How to Use Supports and Resistances in Technical Analysis
As mentioned earlier, support and resistance levels are often one of the first concepts we encounter, and their use is quite intuitive.
The basic method of engaging support and resistance levels consists of buying when prices break upward from a resistance level and selling when they break downward from a support level.
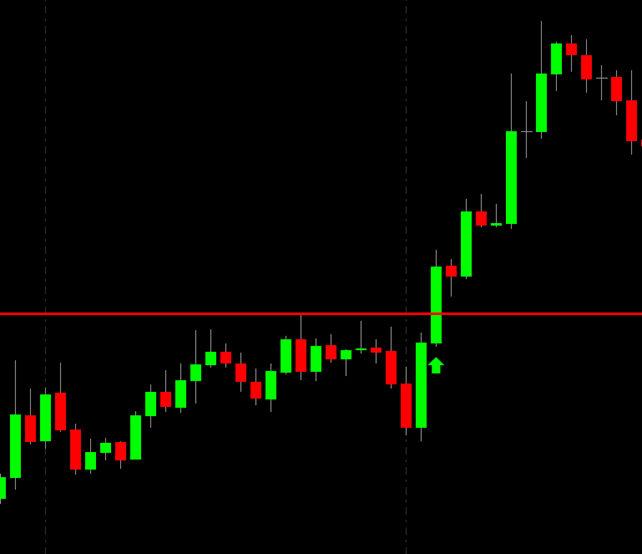
Breaking the resistance level and entering long.
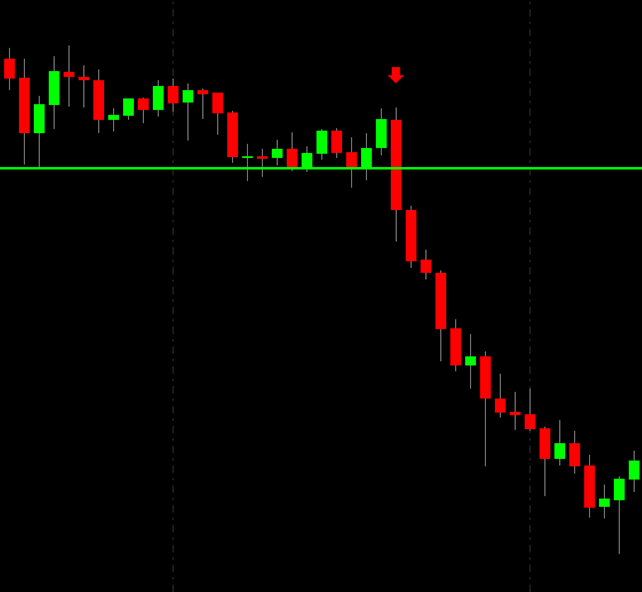
Breaking the support level and entering short.
Behind this application is the idea that if a price breaks the most recent high (or low), the possibility of a significant change in supply/demand levels is likely. Therefore it might make sense to apply trend-following logic.
Another use is to identify false breakouts. A false breakout occurs when a price breaks a support level or a resistance level without having the momentum to maintain that direction.
The strategy is to wait for a false breakout and enter the market only after it has taken place.
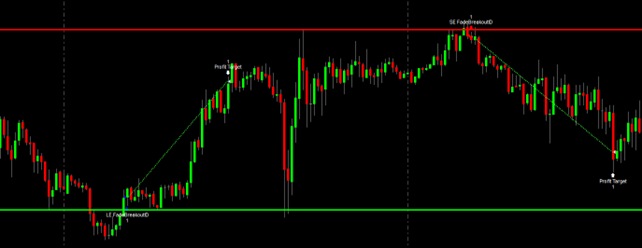
Bullish and bearish false breakout.
For example, if the trend is upward and the price is moving back toward a support level, the idea is to let the price break below the support level and then buy when it starts to rise above the support level.
Similarly, if the trend is downward and the price is coming back toward a resistance level, one should let the price break above the resistance level and then sell when the price starts to fall below the resistance level.
How to Use Support and Resistance Levels in Systematic Trading
Support and resistance levels are more complicated to use in systematic trading.
As you may know, we send fixed orders to our algorithm in systematic trading, which will then execute those commands even in our absence. Computers need very specific rules to be able to understand what we want them to analyze.
However, in the case of support and resistance levels, this may involve a substantial amount of programming and information entry. Programming then becomes more time-consuming and complex than in other approaches or indicators, especially in terms of numbers of lines of code and possible scenarios.
This type of effort discourages the use of support and resistance levels in trading systems, since there tend to be other approaches requiring less effort that yield more.
Beyond this factor, can support and resistance levels help improve your performance in live trading?
In the video below, Andrea Unger answers this very question, explaining the critical issue associated with the application of supports and resistances in systematic trading.
The Problem with Data
There is a problem in applying support and resistance levels that affects both discretionary and systematic traders: data.
As Andrea explains in the video, if we take a stock that has paid dividends over time, the data provider may have adjusted its price data to remove any gaps due to the dividend. In that case, the graphical support lines often make no sense as they refer to artificially reconstructed prices that don’t correspond to the true prices.
The same happens with futures. When one contract expires and we move on to the next, price gaps can be generated. In historical data, these gaps can be left intact or they can be manipulated so that the gaps are eliminated. The latter is referred to as “backadjusted” data, namely, data that has been “adjusted” after the fact.
Once again, prices are artificially reconstructed and don’t correspond to the market values effectively touched by futures over time. Therefore, the support and resistance levels identified in this data aren’t reliable.
For more details, we suggest you follow Andrea’s explanation in the video.
Conclusion
As seen in this article, support and resistance levels have several characteristics that limit their applicability and efficiency.
These levels might be helpful for discretionary traders, as they are rather “intuitive” and easy to spot at a glance. For those engaged in systematic or algorithmic trading, however, support and resistance levels don’t seem to offer any real advantage.
In addition to greater difficulties associated with programming at these levels, similar to what happens with Pivot Points, we have the impression that support and resistance levels present an unnecessary complication. In addition, it should be noted that difficulties can also be encountered when distinguishing true support and resistance levels from price levels randomly generated by market chaos.
Therefore, as far as systematic trading is concerned, we believe that there are undoubtedly better approaches both in terms of simplicity and effectiveness.