
Welcome to a new edition of our portfolio strategy analysis. Today we’ll focus on a market that is as fascinating as it is challenging: Crude Oil, one of the most important and widely traded energy futures in the world.
Over the past few years, this market has put even the most experienced traders to the test. In particular, starting in 2022, due to a particularly unstable macroeconomic and geopolitical environment, Crude Oil has displayed highly erratic behavior, alternating between directional phases and long periods of sideways movement, with false breakouts and sudden mean reversions. All of this has made it much more difficult for many strategies to maintain the level of consistency they may have shown in the past. However, not all systems have buckled under market pressure.
In today’s report, we will analyze two trend following strategies— a classic approach that is far from easy to implement effectively in such a dynamic market. We’ll see if and how these two systems have stood the test of the past two to three years, during a particularly complex period in market history.
Ready? Let’s dive into the details of the strategies.
Strategy No. 1: Multiday Trend Following with Moving Average Crossovers
The first strategy we’ll analyze operates on a 15-minute time frame and is based on a classic, yet still highly effective approach: the crossover of moving averages.
Specifically, two simple moving averages are used: a fast one set to 30 periods and a slow one set to 140 periods. When the fast-moving average crosses above the slow one, the system opens a long position; conversely, when it crosses below, it opens a short position.
As shown in Figure 1, the entry occurs when the crossover takes place. Completing the setup are a series of proprietary filters and a specific time window for trading, designed to exclude statistically less efficient hours.
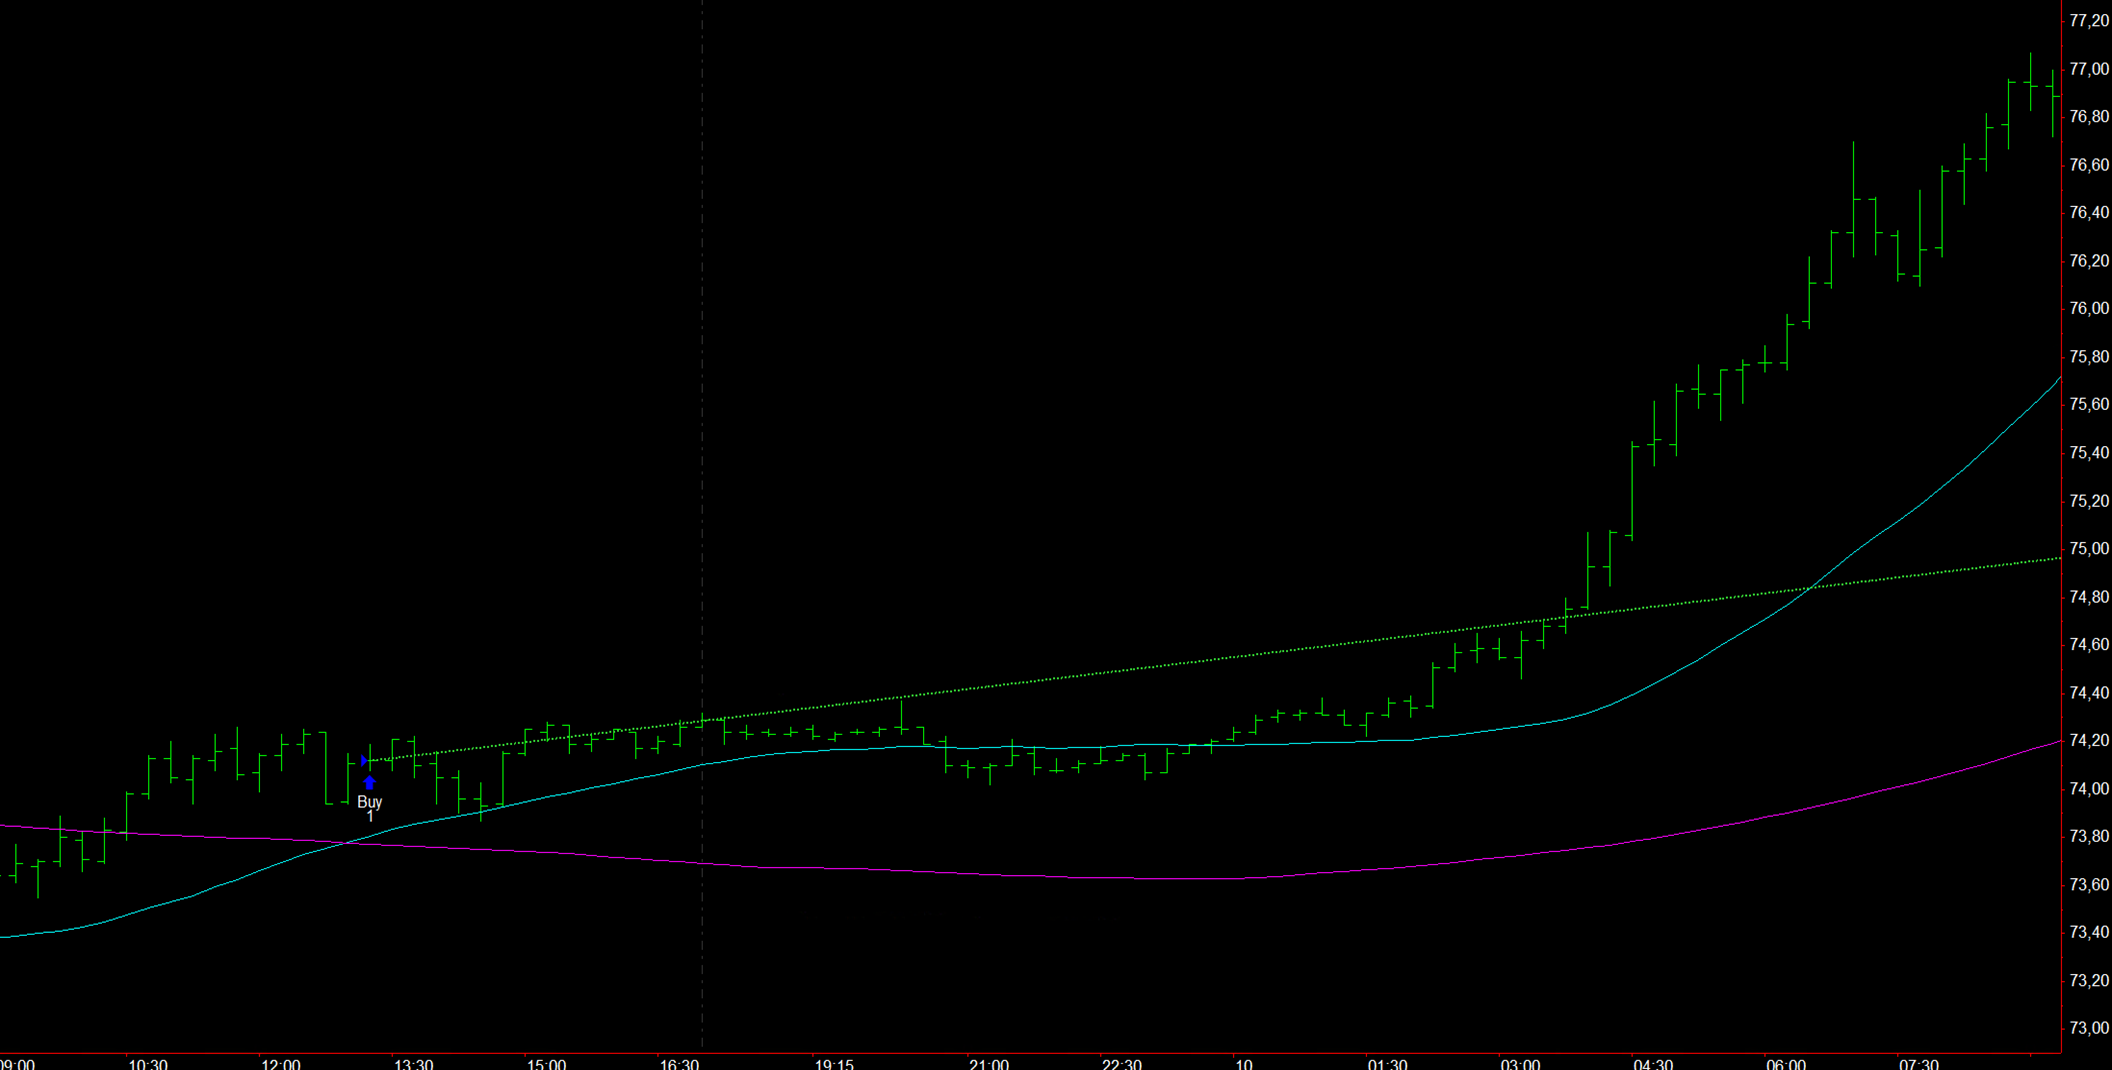
Figure 1 – Example of a long entry following the moving average crossover.
Results of the Moving Average Strategy on Crude Oil: Equity Line, Average Trade, and Win Rate
Looking at the historical results, what immediately stands out is the linearity of the equity line (see Figure 2). From 2010 to today, the profit curve has shown a steady upward trend, even during the more challenging recent years, with consistently contained drawdowns.
The Total Trade Analysis (Figure 3) shows an average trade of $219.66, which is an excellent value considering the underlying asset. This figure makes the system more than capable of covering slippage and trading costs, a fundamental requirement for real-life trading application.
It’s worth noting, however, that the strategy’s win rate is relatively low, with a percentage of winning trades at 27.69%. This is entirely consistent with trend following logic, where the goal is to achieve a few highly profitable trades, letting the profits run and cutting losses quickly.
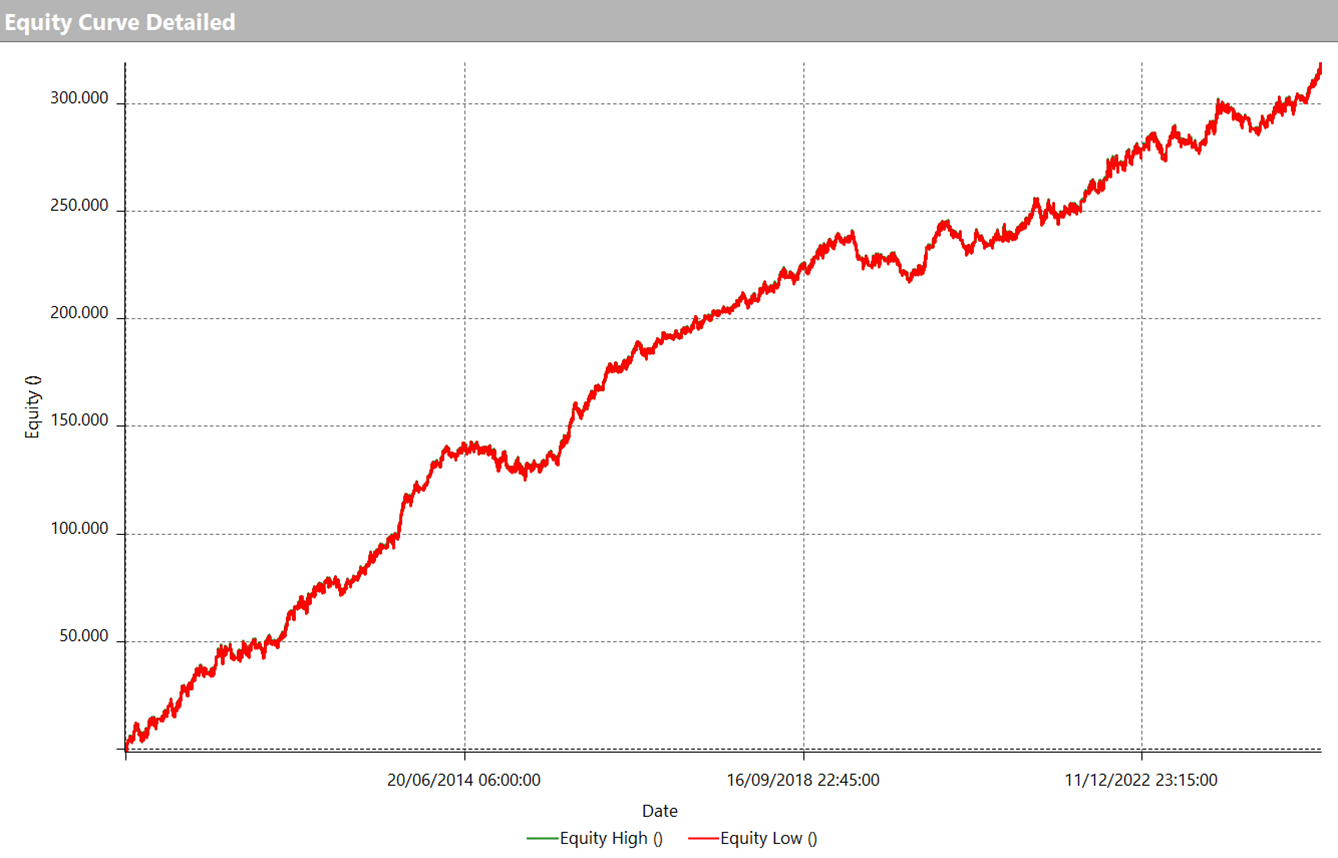
Figure 2 – Equity line of the multiday trend following strategy on the Crude Oil future based on moving average crossovers.
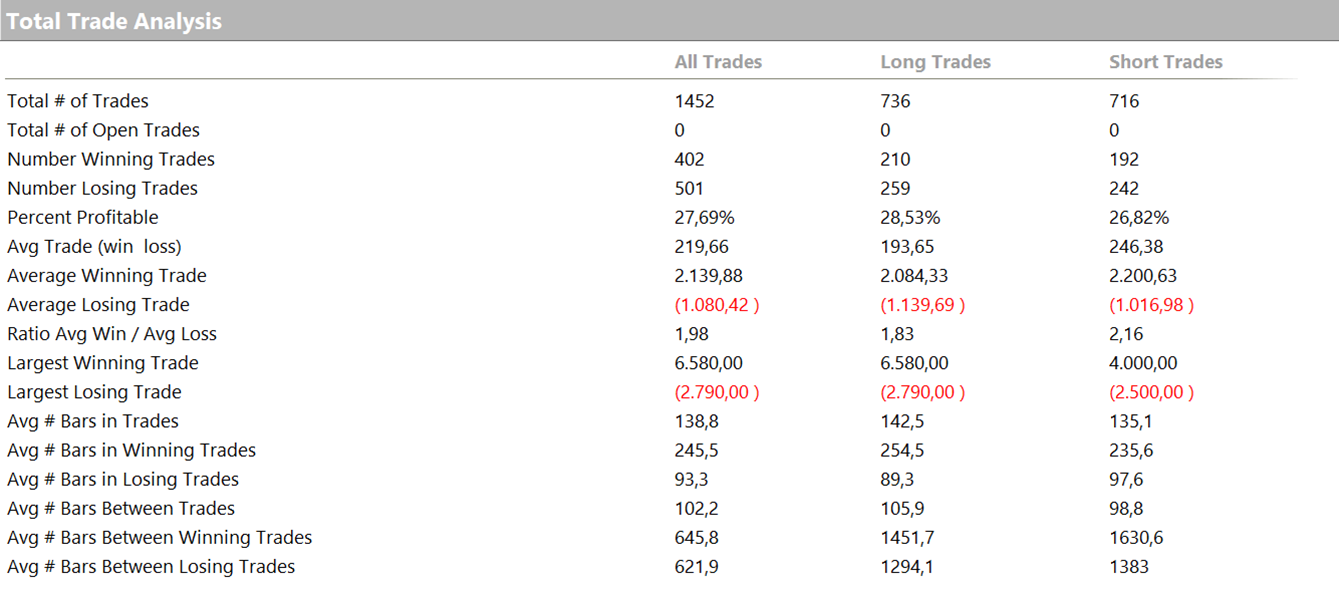
Figure 3 – Total Trade Analysis of the multiday trend following strategy on the Crude Oil future based on moving average crossovers.
Analyzing the annual returns (Figure 4), we can see that the strategy performed well even in the most recent years, including the post-2022 period, which posed challenges for many traders. In particular, 2025 started off with excellent results, already recording a profit of nearly $17,000 in the first few months of the year, with a win rate of over 60%—a sign that the strategy is successfully capturing the market’s current dynamics.
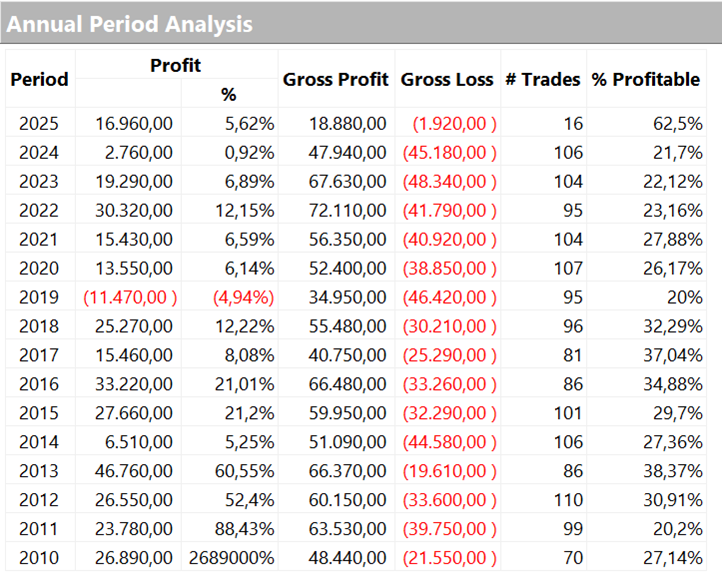
Figure 4 – Annual Period Analysis of the multiday trend following strategy on the Crude Oil future based on moving average crossovers.
Strategy No. 2: Intraday Trend Following Breakout
Let’s now move on to the second strategy, which operates on an intraday basis and uses an early breakout logic based on the previous session’s levels.
The mechanism is fairly simple: it considers the highs and lows of the previous day, but instead of entering the market at the breakout, the system does so slightly earlier.
Specifically:
-For long entries, a certain number of ticks is subtracted from the previous session’s high.
-For short entries, as shown in Figure 5, a number of ticks is added to the previous session’s low, allowing the system to enter before the actual breakout occurs.
The objective is to catch the moment when volatility begins to rise, taking advantage of the typical acceleration that precedes breakouts, without waiting for confirmation. Positions are always closed by the end of the trading day.
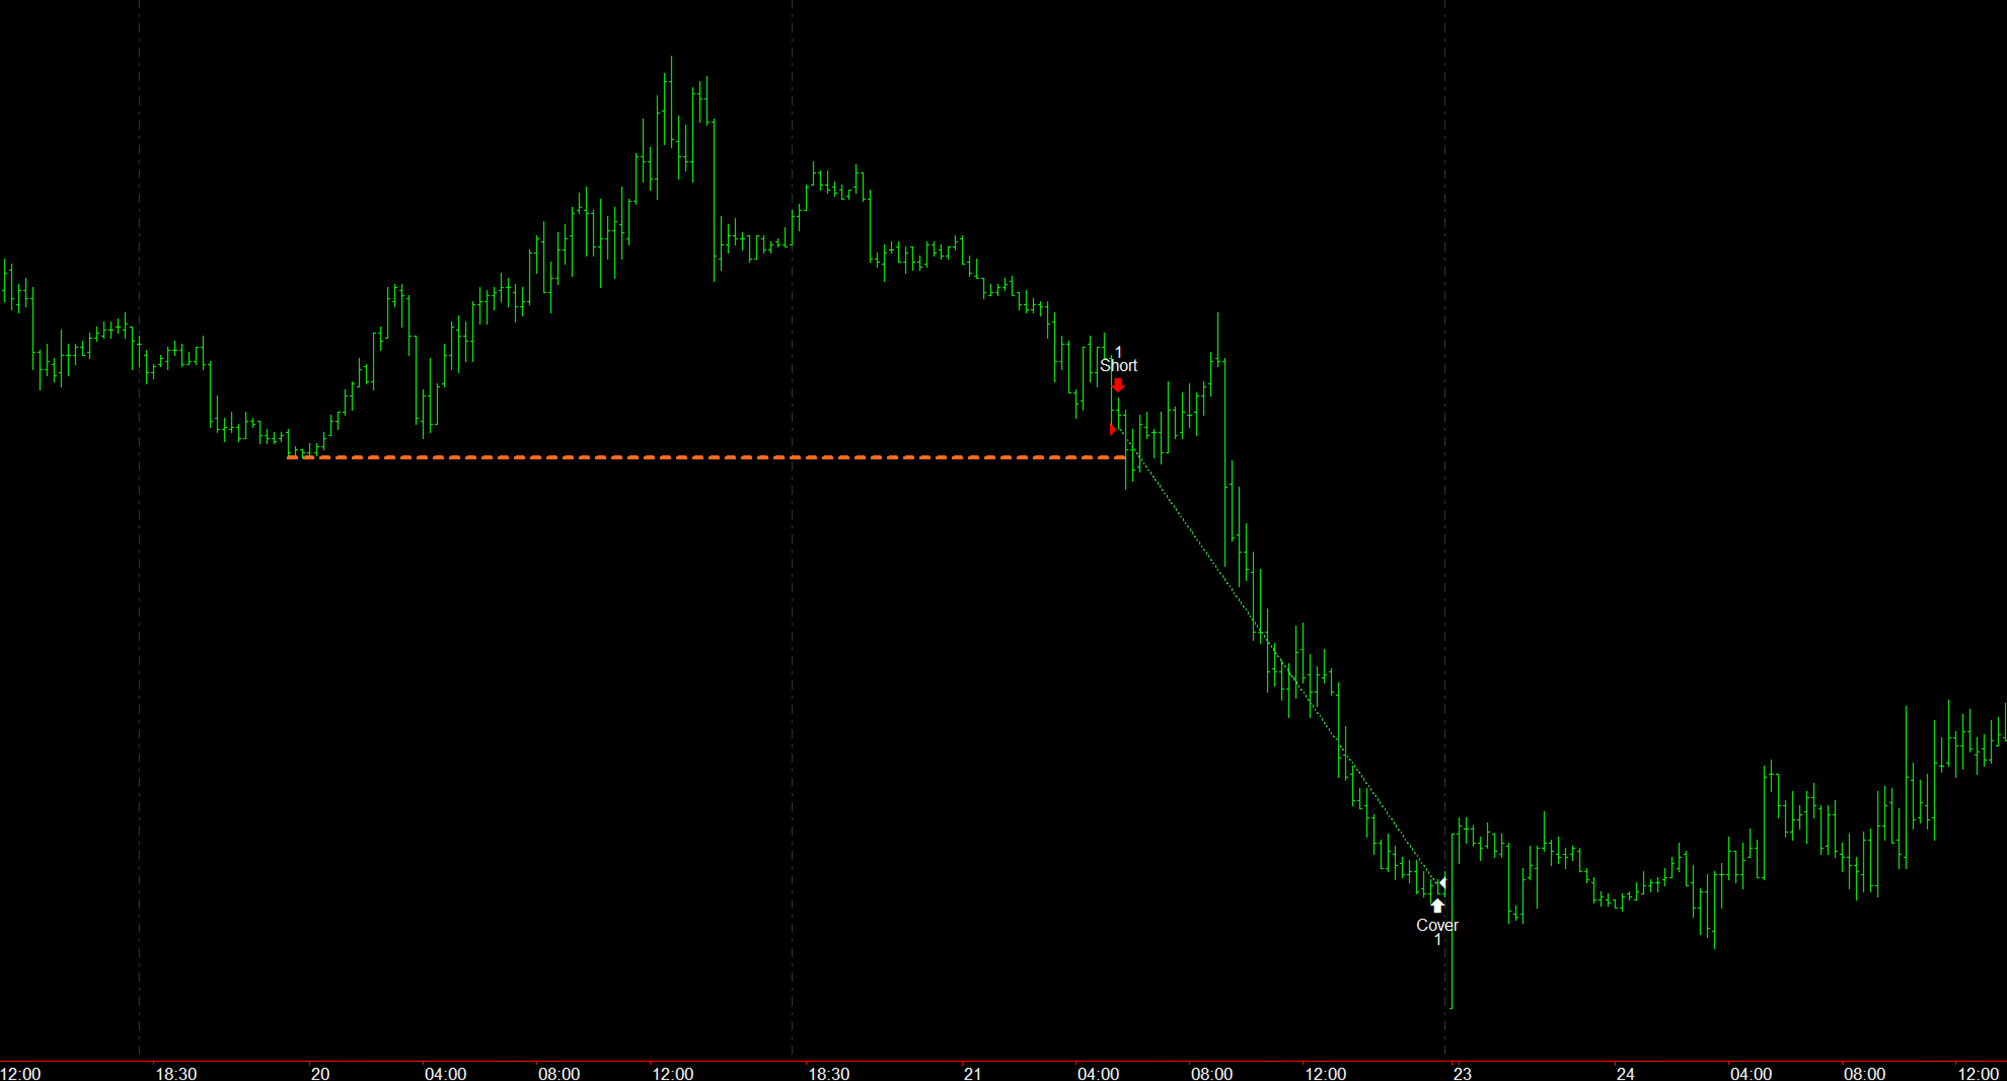
Figure 5 – Example of an early short entry executed by the breakout strategy on the Crude Oil future.
Performance Analysis: Consistent Equity Line and Sustainable Average Trade for Live Trading
The most evident aspect is the excellent linearity of the equity line (Figure 6), which shows consistent growth without prolonged drawdown periods.
As for the other metrics, the average trade stands at $166.53, as shown in Figure 7. This value is lower than that of the multiday strategy discussed earlier but is entirely consistent with the shorter time horizon of the trades. Since this is an intraday strategy, the market exposure is significantly shorter, and as a result, the average trade is also lower.
Nonetheless, the average trade value is sufficient to cover operational costs such as slippage and commissions, making the strategy realistically applicable in a live trading context.
Figure 6 – Equity line of the intraday breakout strategy on the Crude Oil future.
Figure 7 – Total Trade Analysis of the intraday breakout strategy on the Crude Oil future.
Takeaways from the Two Automated Trend-Following Strategies on Crude Oil
Even in a highly volatile and unpredictable market like Crude Oil, there are systematic strategies capable of successfully meeting the challenges posed by market conditions. The two strategies analyzed today—a multiday system based on moving average crossovers and an intraday system using early breakout logic—have delivered solid and sustainable results even during the most turbulent years.
Both are built on simple yet robust logic and share a fundamental trait: they are automatable and therefore ideal for traders who want to operate systematically, reducing operational stress and increasing efficiency.
Of course, no system can guarantee consistent profits or the absence of risk. But what truly makes a difference in the long run is the quality of the method used, the ability to adapt to market conditions, and the efficiency of execution.
It could be your first concrete step toward transforming your approach to trading.
Until the next analysis—happy systematic trading to all!


