In the world of commodities, the Gold futures contract traded on the New York COMEX remains one of the most attractive instruments for systematic traders. With a trading session running from 6:00 PM to 5:00 PM (exchange time) and high liquidity, this contract is ideal for developing automated strategies.
In 2025, Gold exhibited particularly strong directional moves, creating fertile ground for trend-following systems.
In this article, we’ll analyze two multiday strategies that rely on different dynamics but share the same goal: capturing the market’s most explosive trends.
We’ll break down how these systems are built, their entry and exit rules, and how they’ve performed over time, with the aim of understanding if and how they can fit within a diversified trading strategy portfolio.
Strategy 1: Trend-Following on Gold Using the CCI Indicator
We begin with a simple strategy based on the Commodity Channel Index (CCI). The CCI is an oscillator – an indicator that fluctuates around a fixed value, in this case, zero. Typically, it’s used to identify overbought and oversold zones, anticipating price reversals and a return to the mean.
However, this strategy flips that logic: we use the CCI for trend-following, aiming to ride out explosive market movements rather than counter them.
The rule is straightforward:
- Enter long when the CCI crosses above +300
- Enter short when it drops below -300
- Exit when the CCI returns toward zero
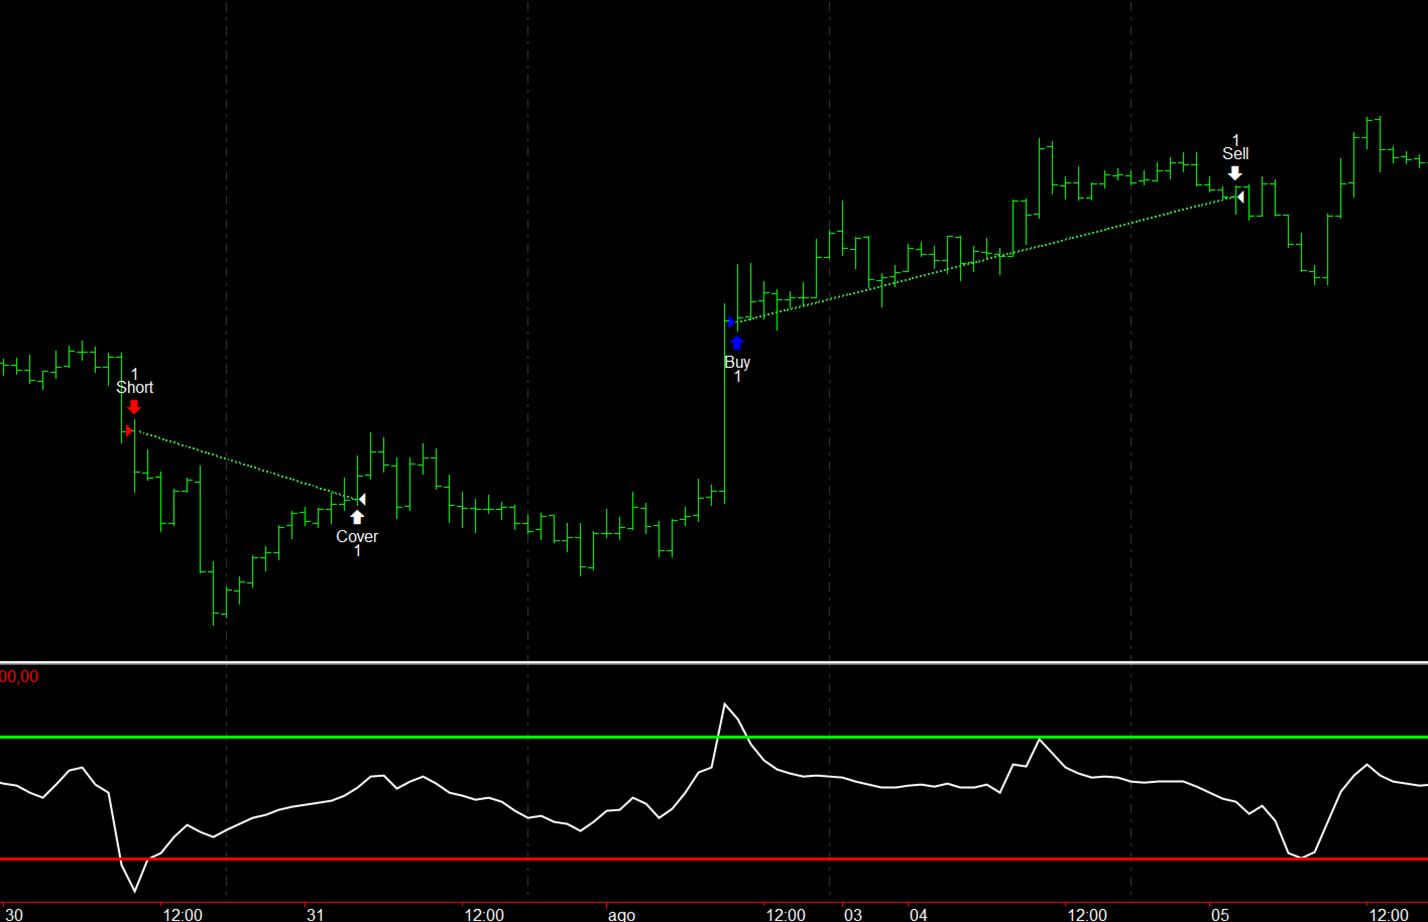
As shown in Figure 1, the first short signal is triggered when the CCI breaks below -300 (red line), and the position closes as it returns toward zero. A long signal follows as the CCI rises above +300 (green line), which is held until the indicator drops back to the neutral area.
This setup helps the strategy ride Gold’s strongest trends while avoiding exposure during periods of market balance.
CCI-Based Strategy Performance
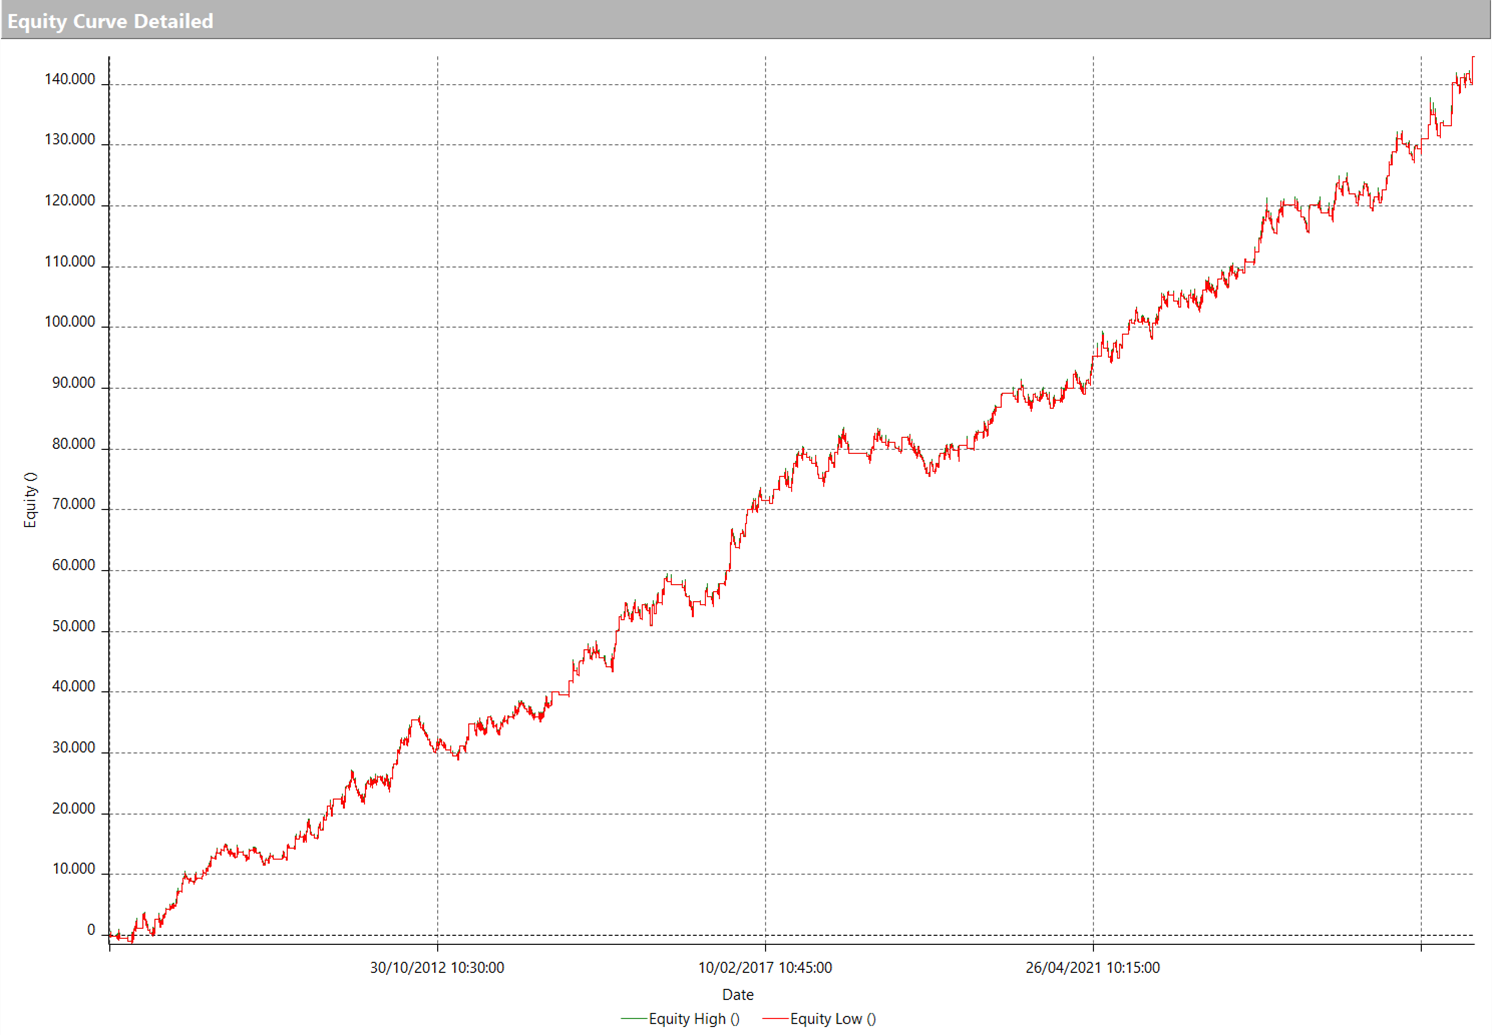
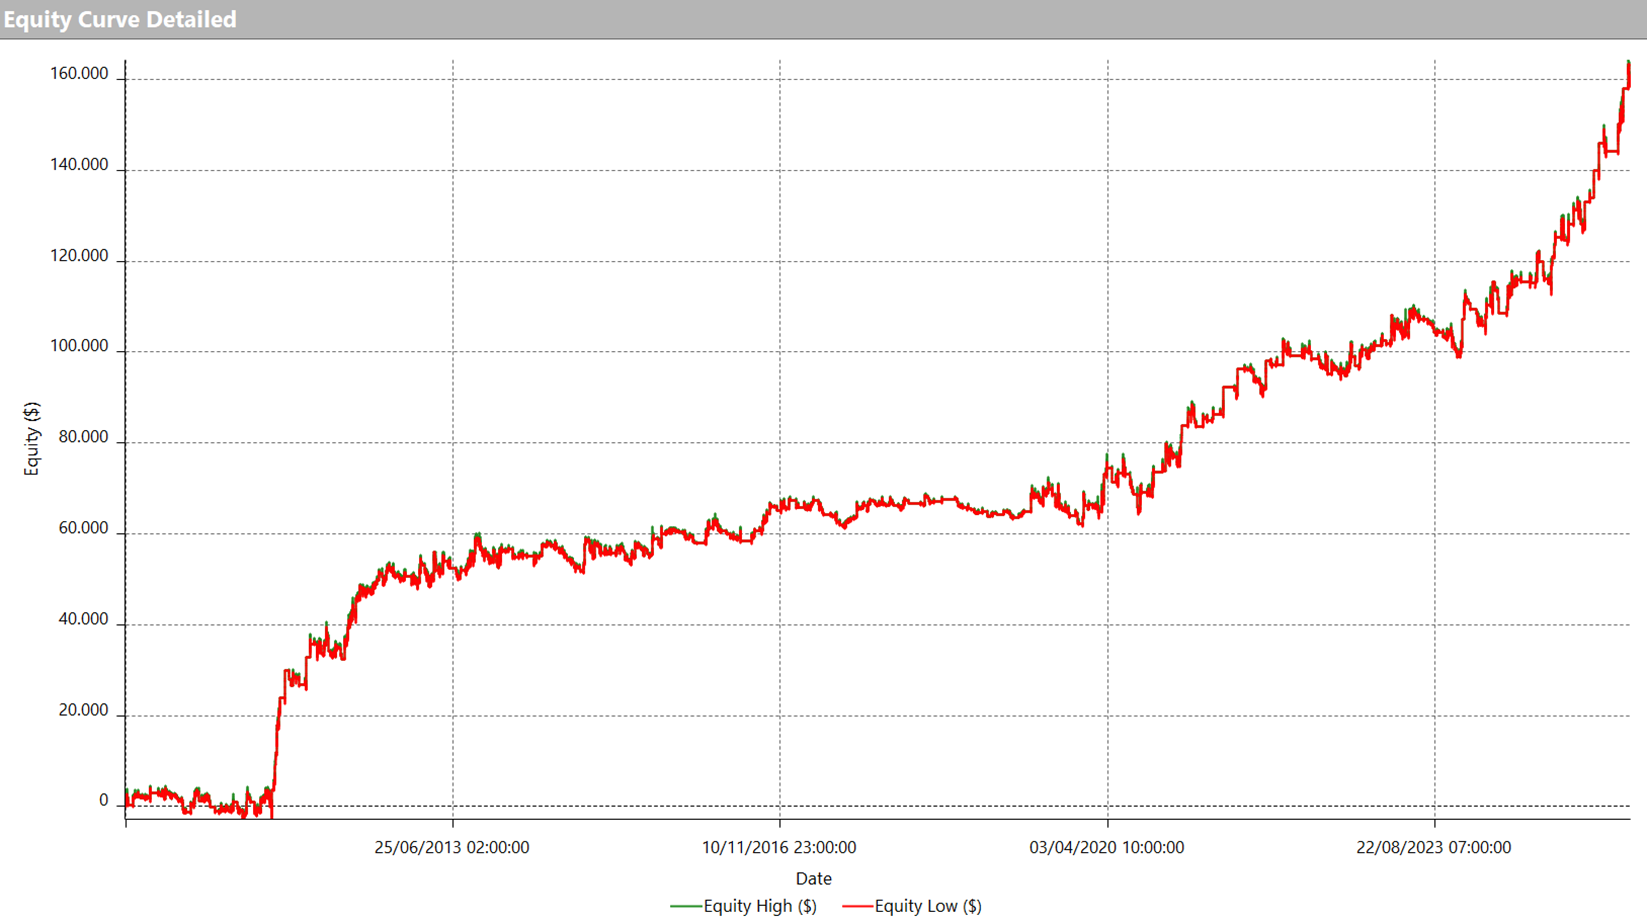
Looking at the performance (Figure 2), the equity curve is quite steady: after a modest initial phase, it progresses in an orderly fashion, with some consolidation but no major drawdowns. Toward the end of the backtest, 2025 provides a strong boost, with a string of winning trades pushing the equity to new highs.
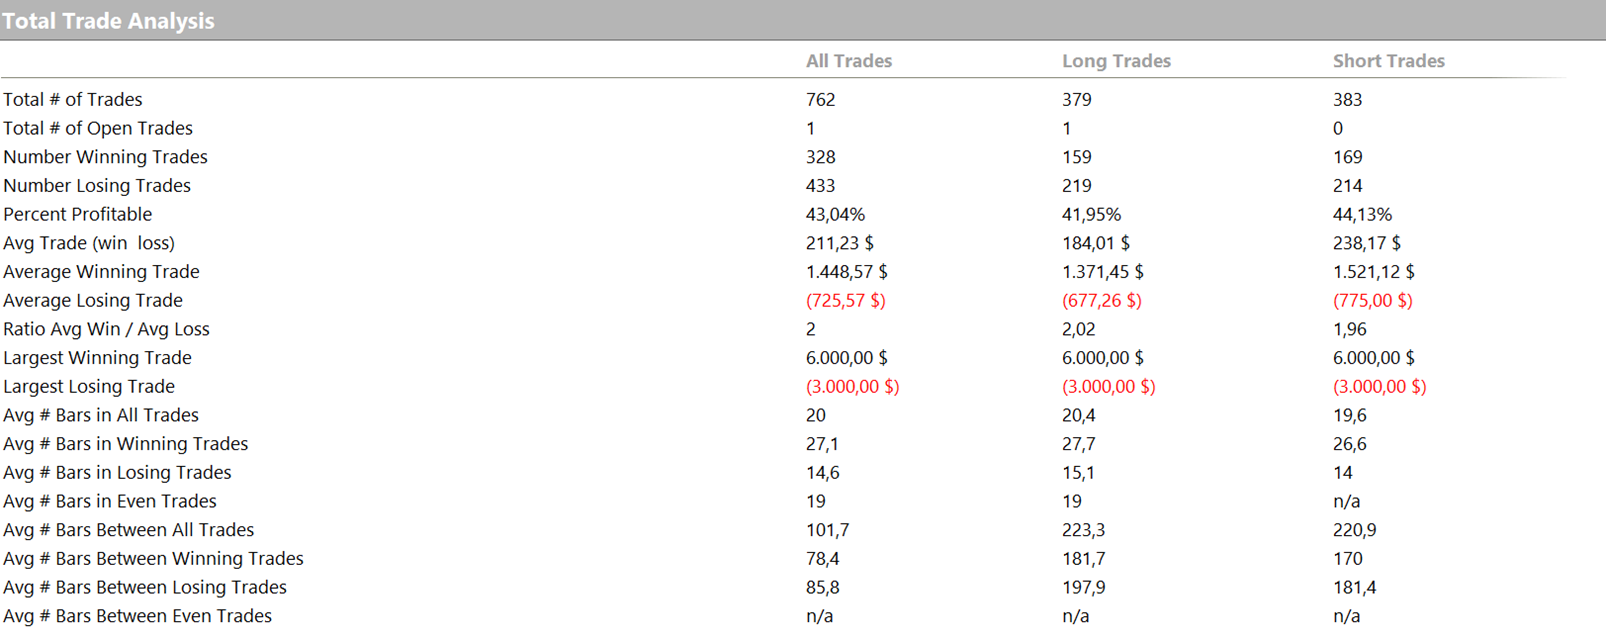
According to the Total Trade Analysis (Figure 3), the average trade is slightly over $200, more than enough to cover commissions and slippage on this futures contract.
The strategy generates a few hundred trades over the full historical range, reflecting a selective logic. This is largely due to the use of extreme CCI thresholds: while typical setups use ±100, we’ve set ours to ±300, three times further out.
This means signals are rarer, but when they appear, they tend to coincide with explosive market phases, the exact target of this strategy.
Strategy 2: Breakout of Highs and Lows
Let’s move to the second strategy, also a multiday trend-following system, but based on a completely different logic. This one doesn’t use indicators; instead, it relies on the previous session’s highs and lows as key levels.
Entry Rules
Within a specific time window (e.g., early in the trading session), the strategy places stop orders as follows:
- Buy stop at the breakout of the previous day’s high
- Sell stop at the breakout of the previous day’s low
The goal again is to capture momentum: if the market breaks past key extremes, it’s assumed it will continue in that direction.
Exit rules are based on fixed monetary values for both stop loss and profit target – identical across all trades. Once a position is opened, it can remain active for multiple days until one of these levels is hit.
Figure 4 illustrates several trade examples, showing entries at breakouts and exits at profit targets.

Performance of the Highs-and-Lows Breakout Strategy
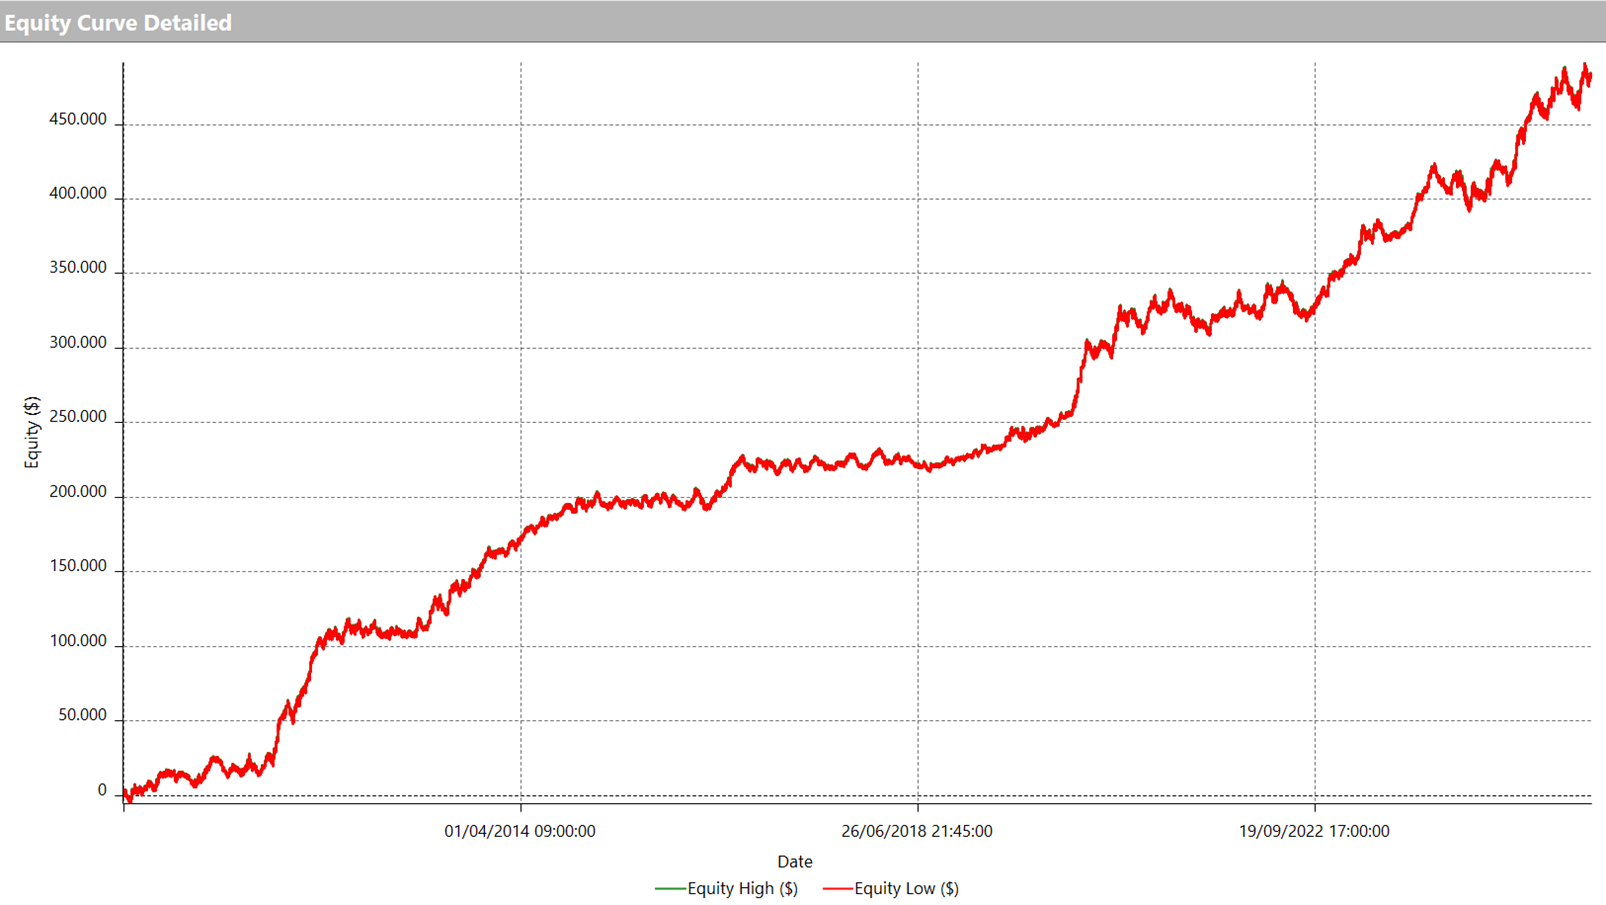
Now let’s look at how this strategy performs (Figures 5 and 6). Again, the equity curve is smooth: after a rapid initial ascent, it continues steadily, with short sideways phases but no significant drawdowns. Toward the end of the backtest, the curve continues to hit new highs, proof that the logic holds up even in recent years.
From the Total Trade Analysis (Figure 6), we see this strategy produces more trades than the previous one, around 1,300 total. The average trade sits at roughly $370, a strong result for a multiday system on Gold futures.
Though the win rate is below 40%, it’s balanced by a win/loss ratio above 2:1, a hallmark of trend-following logic: frequent small losses offset by fewer, larger wins when trends are caught effectively.

Conclusion: Gold Trading with Simple but Powerful Logic
In conclusion, these two examples demonstrate how relatively simple rules can produce compelling results when trading the Gold futures market.
The first strategy uses a classic indicator (CCI), applied with extreme thresholds in a trend-following context.
The second leverages breakouts of prior session highs/lows with fixed monetary exits, no indicators involved.
Despite their simplicity and lack of complex filters, both strategies generate upward-sloping equity lines and average trade values suitable for covering the operational costs of trading Gold futures.
Of course, these systems should be part of a diversified portfolio, but the takeaway is clear:
Even essential, well-designed strategies, when applied with discipline, can serve as solid building blocks for a systematic trading approach on Gold.
Until next time,
Andrea Unger