
Welcome back to a new installment of our portfolio strategy analysis.
In this article, we dive into two automated trading strategies applied to Tesla (TSLA), one of the most volatile and closely watched stocks in the U.S. market. What makes this comparison particularly interesting is the completely different trading logics behind each system: one is designed to capture short-term mean reversion, while the other seeks to ride short-term momentum trends.
We’ll break down each strategy’s rules, show examples of trades, and analyze the results of historical backtests. You’ll see how two contrasting approaches, countertrend vs. trend-following, can both be effective on the same underlying asset, and how they perform over time in different market conditions.
Key Characteristics of Tesla Stock
Tesla is one of the most iconic companies in the automotive and technology sectors, a pioneer in electric mobility and the integration of hardware, software, and energy solutions. Its business extends far beyond electric vehicle production and includes batteries, energy storage systems, solar solutions, and autonomous driving development.
Tesla is among the most highly capitalized and widely discussed stocks in the world. It is characterized by high volatility and often sharp price movements, strongly driven by expectations of future growth, technological innovation, and the public profile of its founder.
Unlike more mature companies, Tesla reflects a long-term growth narrative, with well-defined trends and a high sensitivity to overall market sentiment.
Strategy 1: Countertrend Logic Exploiting Post-Oversold Bounces
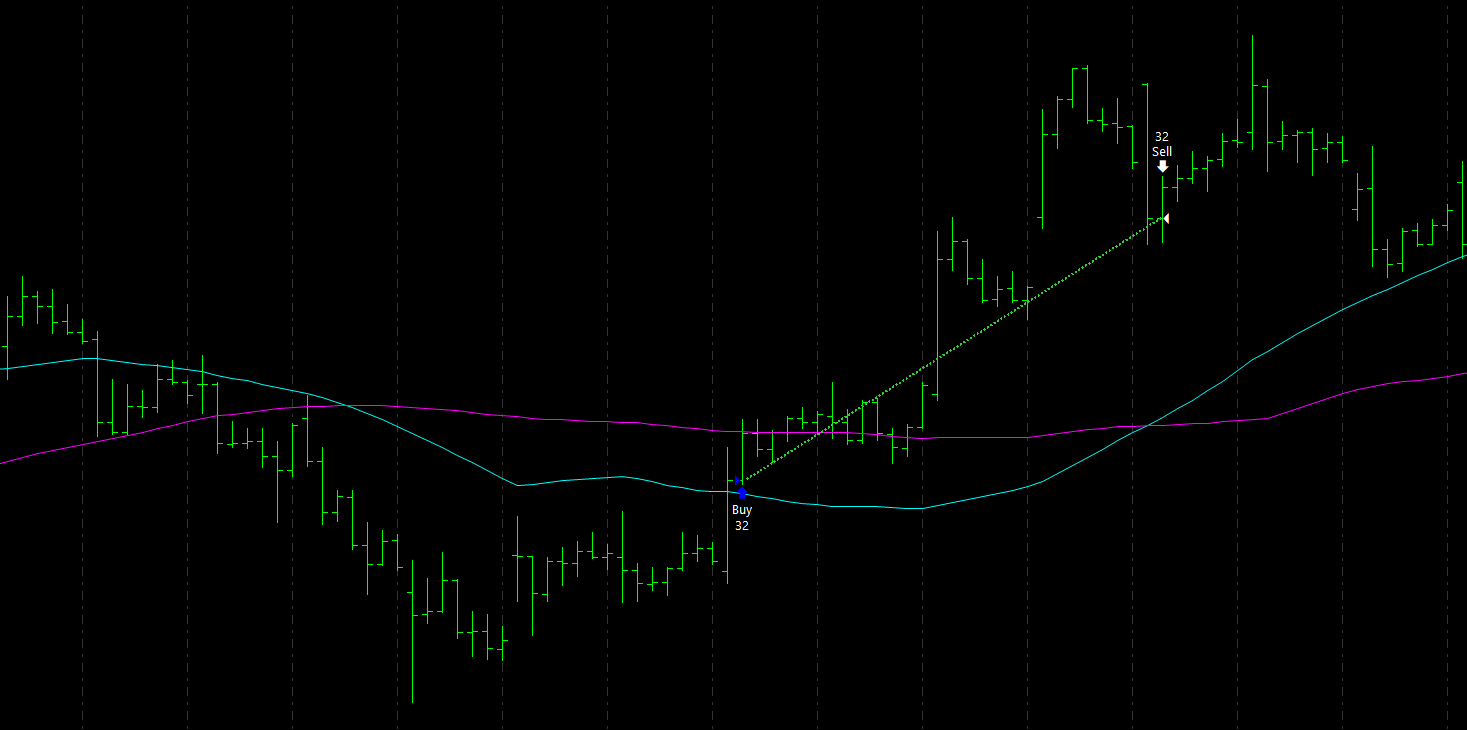
The first strategy analyzed on Tesla operates on a 60-minute time frame. Its objective is to identify a potential rebound after an oversold phase, entering long positions only when the market shows sufficient strength to suggest a possible short-term reversal.
The entry setup is based on two main conditions:
- The price must be below a 100-period simple moving average, indicating an underlying weakness phase.
- The close of the current bar must break above the highest high of the previous 8 bars, representing a bullish breakout and a potential short-term reversal signal.
When both conditions are met, the system opens a long position on the next bar.
Figure 1 shows a clear example of this logic: the entry occurs after a short-term bounce within a broader context that is still weak according to the moving average.
Backtest and Performance of the Countertrend Strategy on Tesla Stock
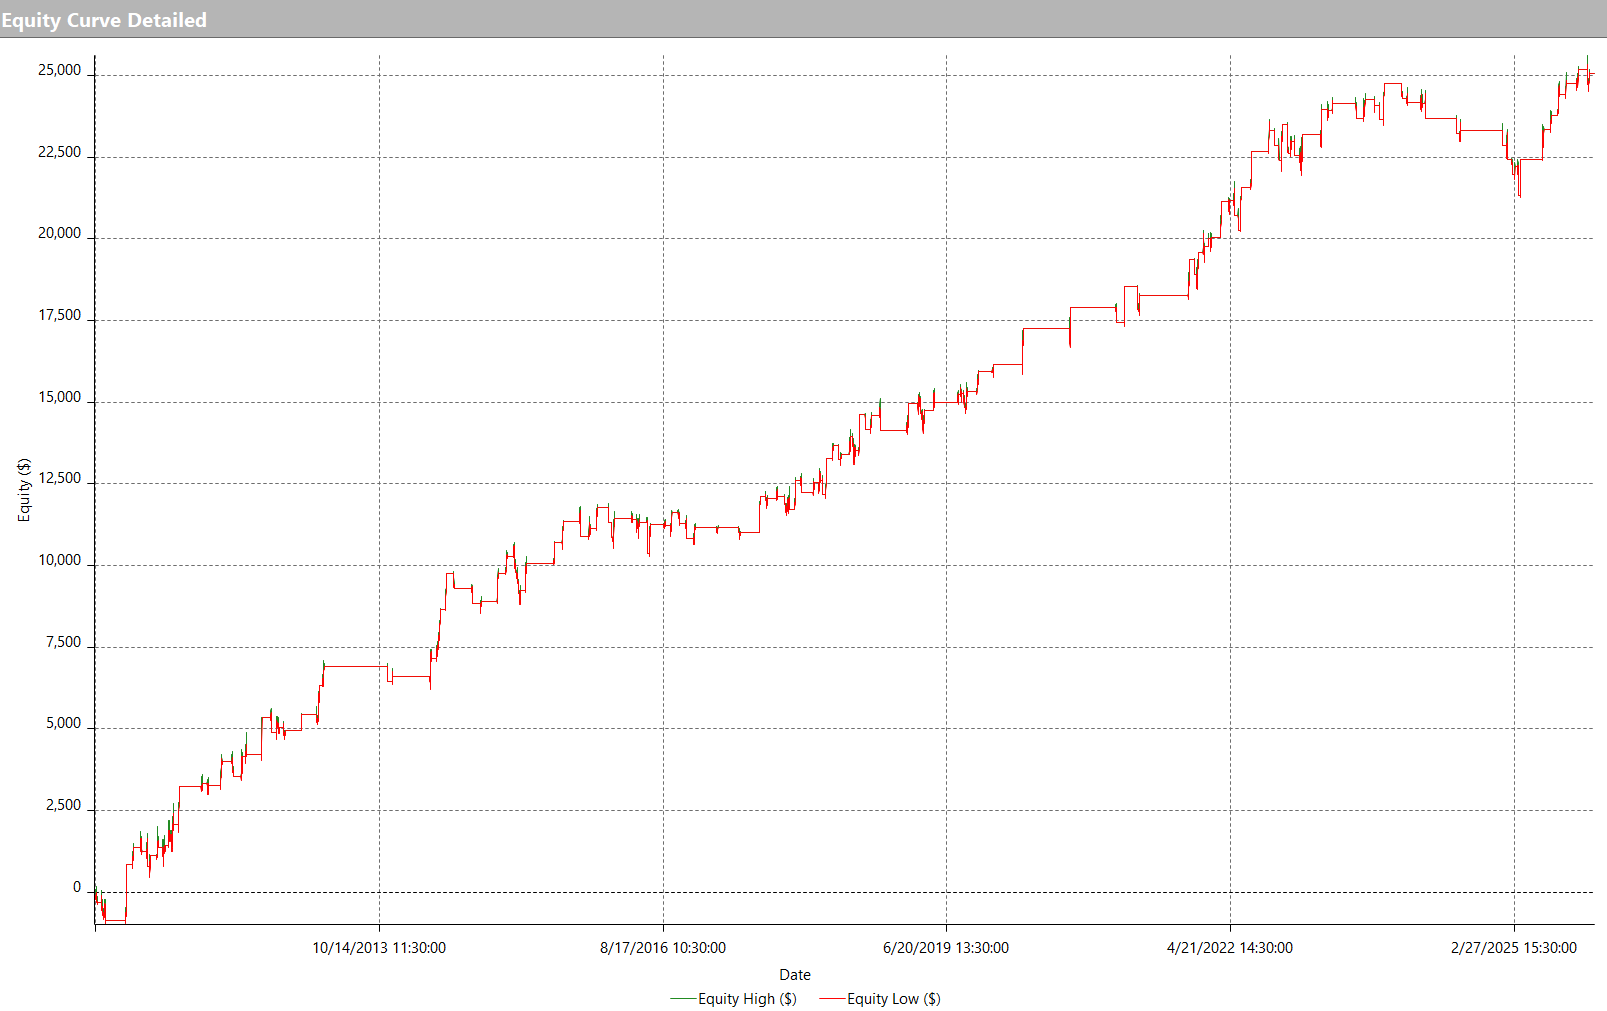
The backtest was conducted using a fixed capital of $10,000 per trade to simulate a realistic and consistent trading approach over time. As shown in Figure 2, the equity line displays steady and regular growth over the years, with only one more pronounced drawdown phase between 2024 and early 2025, which has since been recovered.
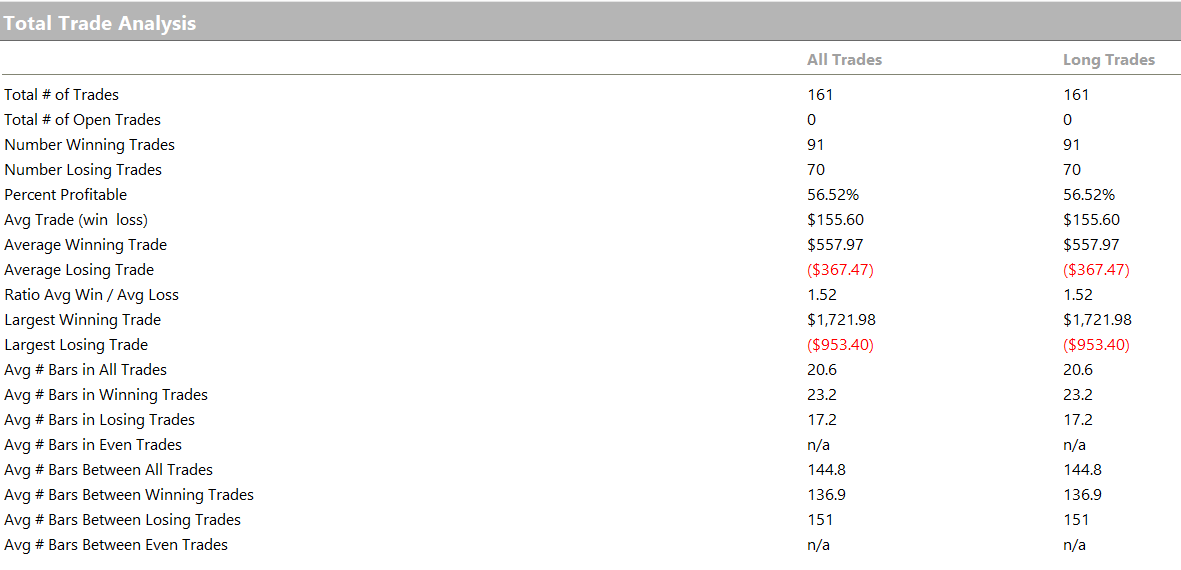
Total net profit approaches $25,000, a highly satisfactory result considering that the system executed only 161 trades over approximately 15 years. This further confirms the selective nature of the strategy, which prioritizes trade quality over frequency.
Figure 3 summarizes the main performance metrics, showing an average trade of $155.60, equivalent to approximately a 1.56% return per trade on the deployed capital.
Strategy 2: Trend-Following Logic Capturing Short-Term Trends
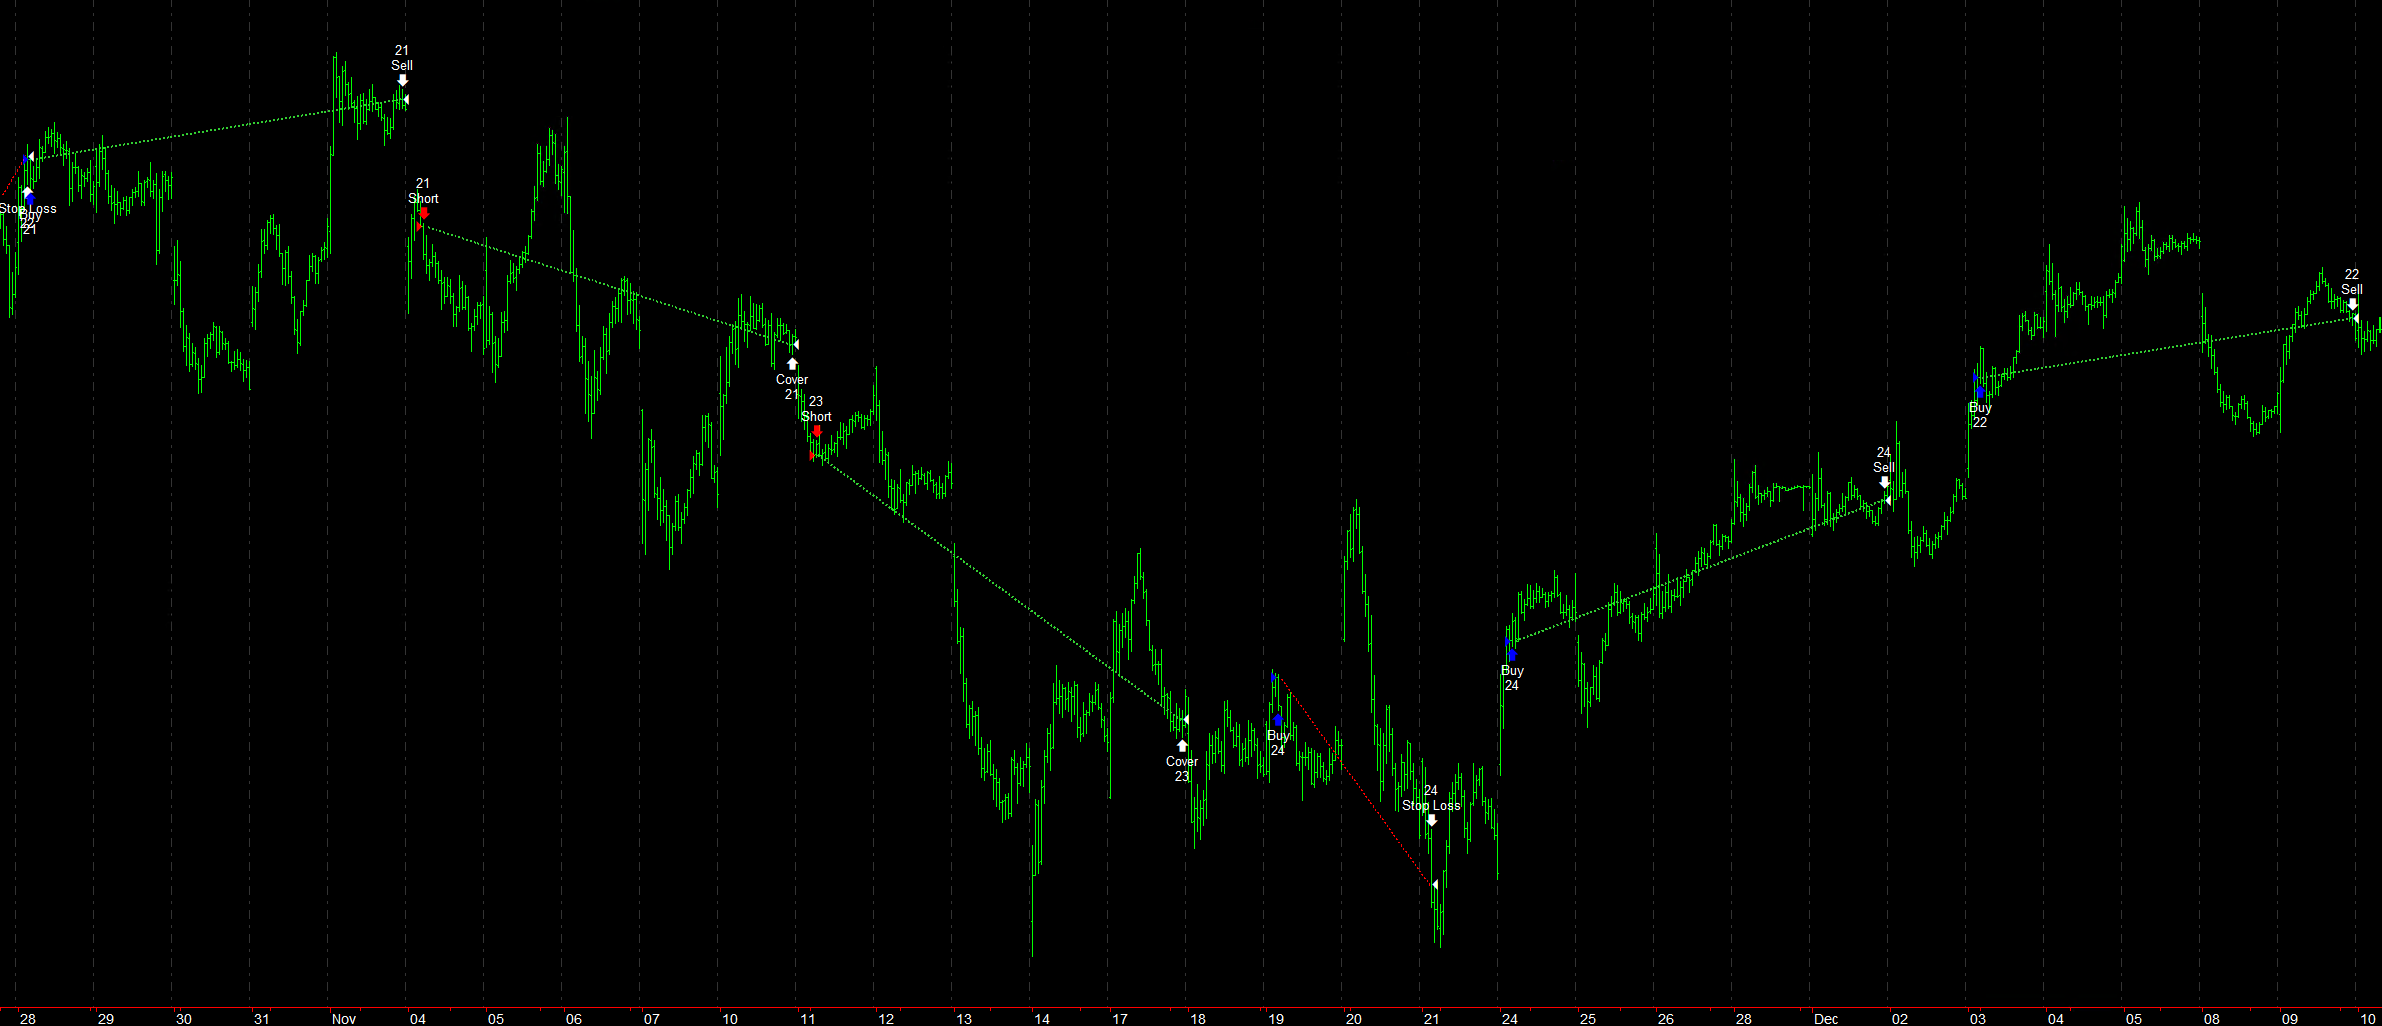
We now move on to the second strategy. Unlike the first, this approach aims to capture short-term trends and operates on a 15-minute time frame.
The trading logic is very straightforward: a long position is opened when the latest bar close breaks above a level defined by the previous close plus a certain amount determined by the price standard deviation over the last 15 hours. The same logic applies in reverse for short positions, with the standard deviation calculated over a longer period.
Figure 4 shows several examples of executed trades.
Positions are closed either when a fixed profit target is reached or, in any case, within five days.
Performance Analysis and Equity Line of the Trend-Following Strategy
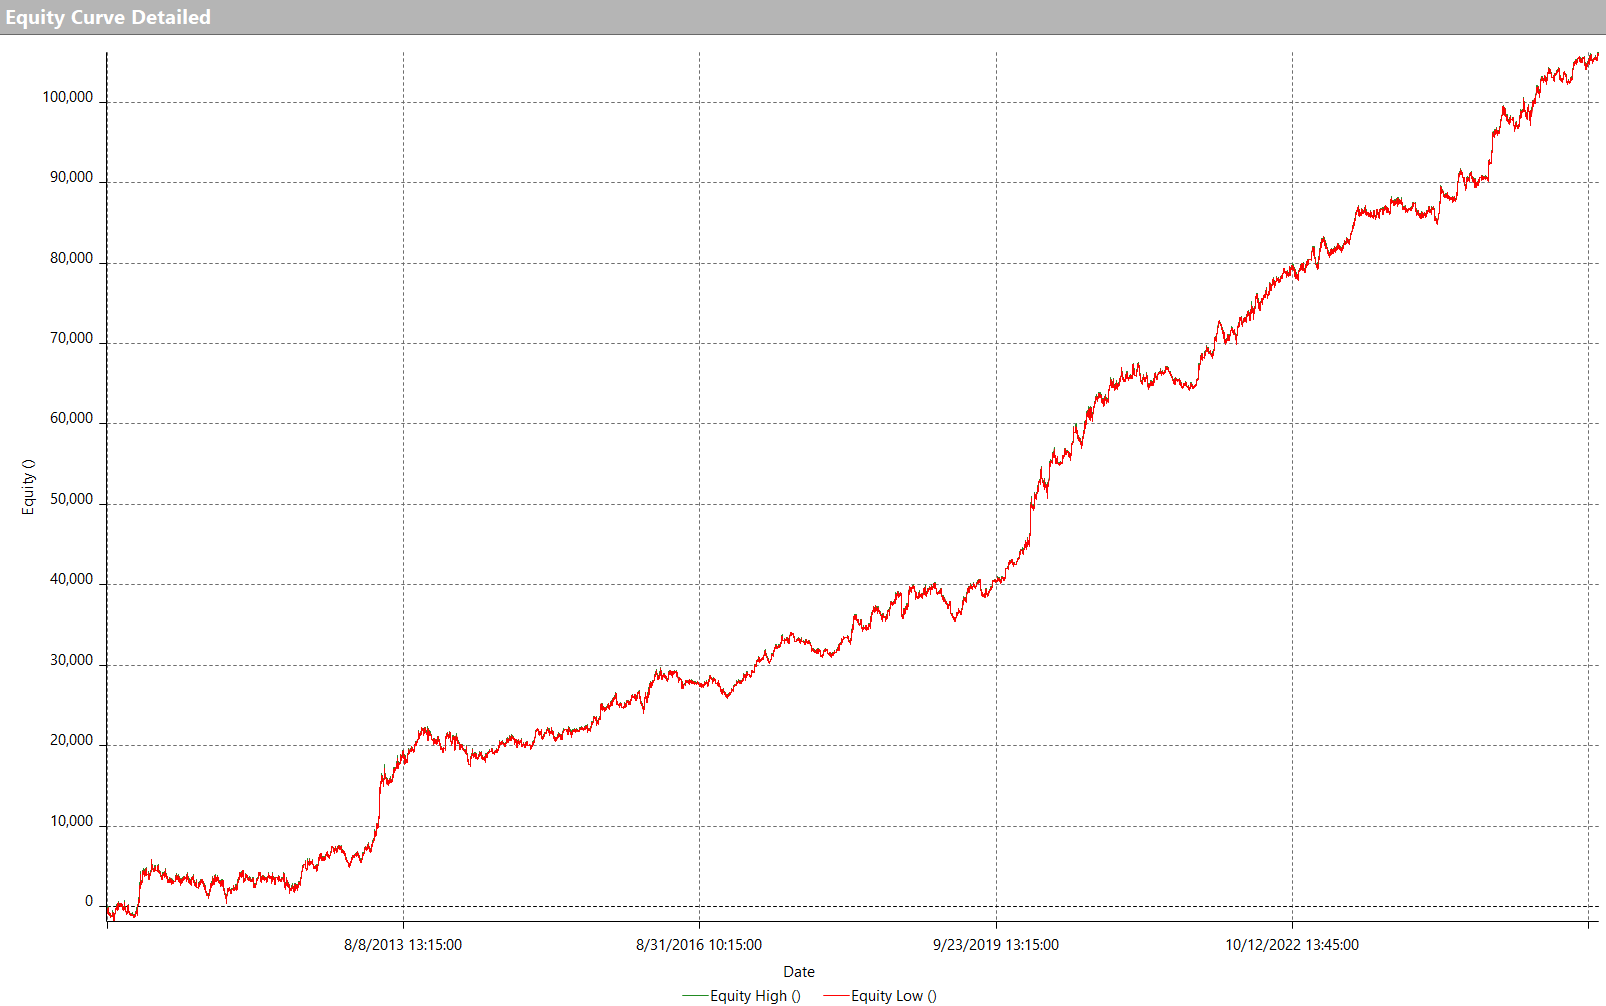
As shown in Figure 5, the equity line of this strategy exhibits a particularly interesting profile. Growth is steady, with phases of strong acceleration and an overall consistent upward trend over time. Total net profit over the roughly 15-year period exceeds $105,000, based on a capital allocation of $10,000 per trade, figures that clearly confirm the robustness of the approach.
One particularly noteworthy aspect is that the strategy has continued to set new all-time equity highs despite the turbulent market conditions experienced toward the end of 2025. This suggests that the strategy adapts well even during less favorable market phases.
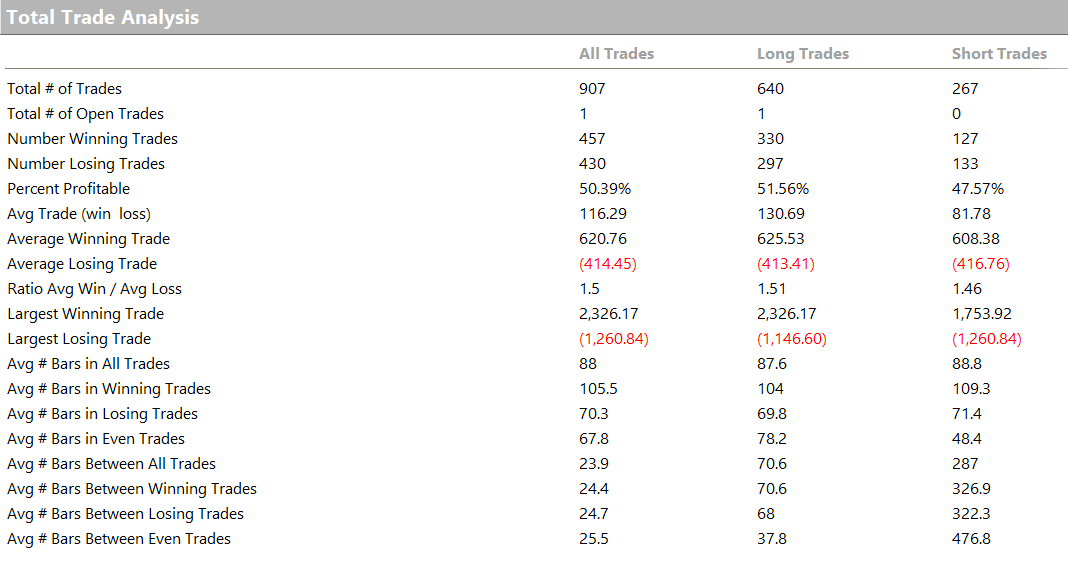
As highlighted in Figure 6, the system executed 907 trades, with a win rate of 50.39%. The average trade amounts to $116, corresponding to approximately a 1.16% return per trade on the allocated capital.
Conclusions: Two Different Logics, One Common Goal
As we have seen, even in the equity market it is possible to apply opposing algorithmic trading logics to the same instrument and still achieve strong results. Simple yet effective models can adapt to different market conditions and deliver consistent performance over time.
The most interesting takeaway is the ability of these systems to generate stable equity curves even when the underlying stock goes through difficult phases or is far from its all-time highs. This confirms that a systematic approach is not limited to derivatives trading but can be successfully applied to individual stocks such as TSLA.
If you would like to learn more about our method for trading the markets using robust and thoroughly tested strategies, click the link below and book a free strategic session.
Until next time, and happy trading!


