
Welcome back to our regular portfolio strategy analysis feature. As we near the end of summer, we’d like to take this opportunity to focus on what has so far been the standout market of the year for systematic traders: gold.
Is Gold the Best Market of 2025 for Systematic Traders?
In 2025, gold has experienced a particularly favorable phase, marked by a strong upward price movement, one that has significantly benefited trend-following strategies.
Thanks to its high liquidity and the availability of the Micro Gold Futures (MGC), gold remains one of the best products for systematic trading, especially when it comes to scaling positions down to smaller sizes.
In this article, we’ll examine two specific strategies to see whether and how they’ve taken advantage of the current market environment.
Ready? Let’s dive in.
Strategy 1: Trend Following with Linear Regression, Statistical Precision Applied to Trading
The first strategy we’ll explore is based on a trend-following logic. In other words, the system attempts to capture trends that form in the gold market.
To calculate the entry levels, we use a well-known statistical indicator: linear regression.
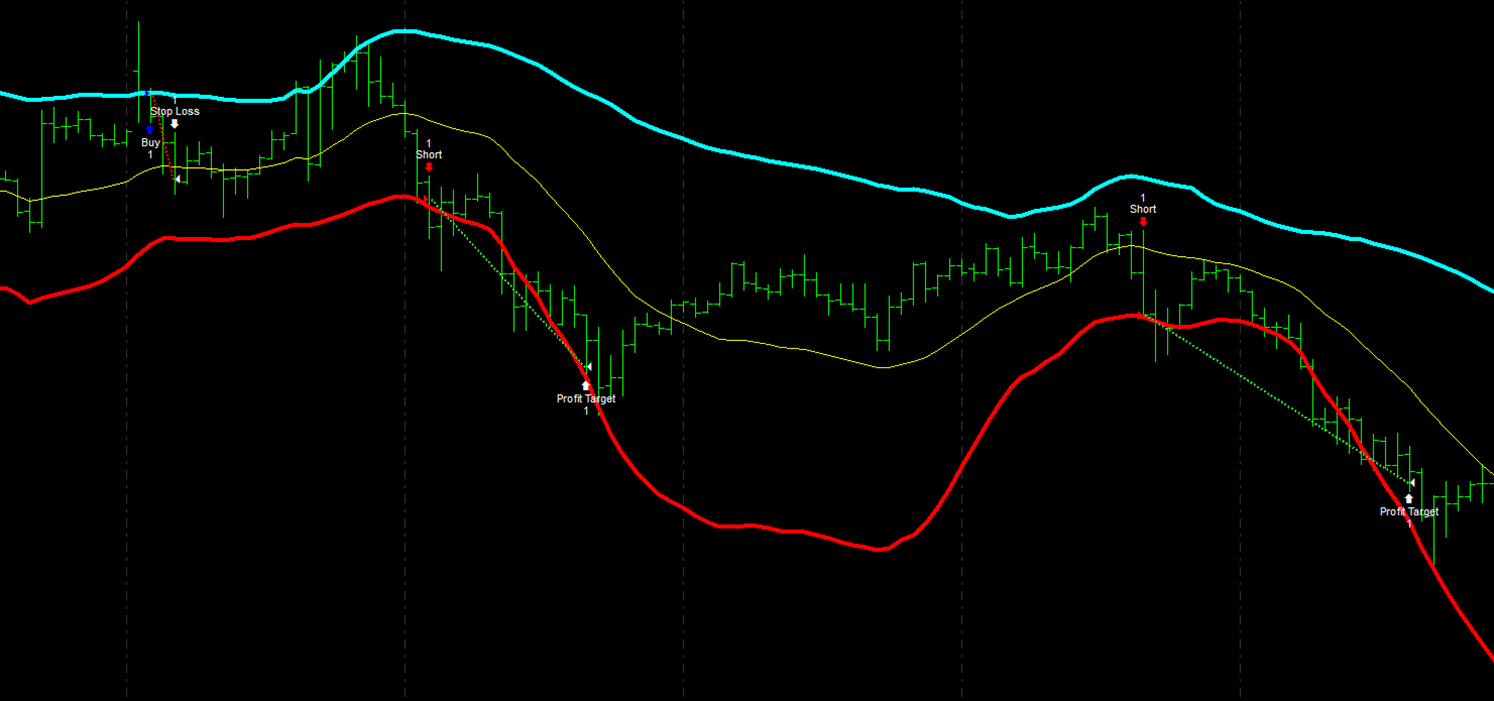
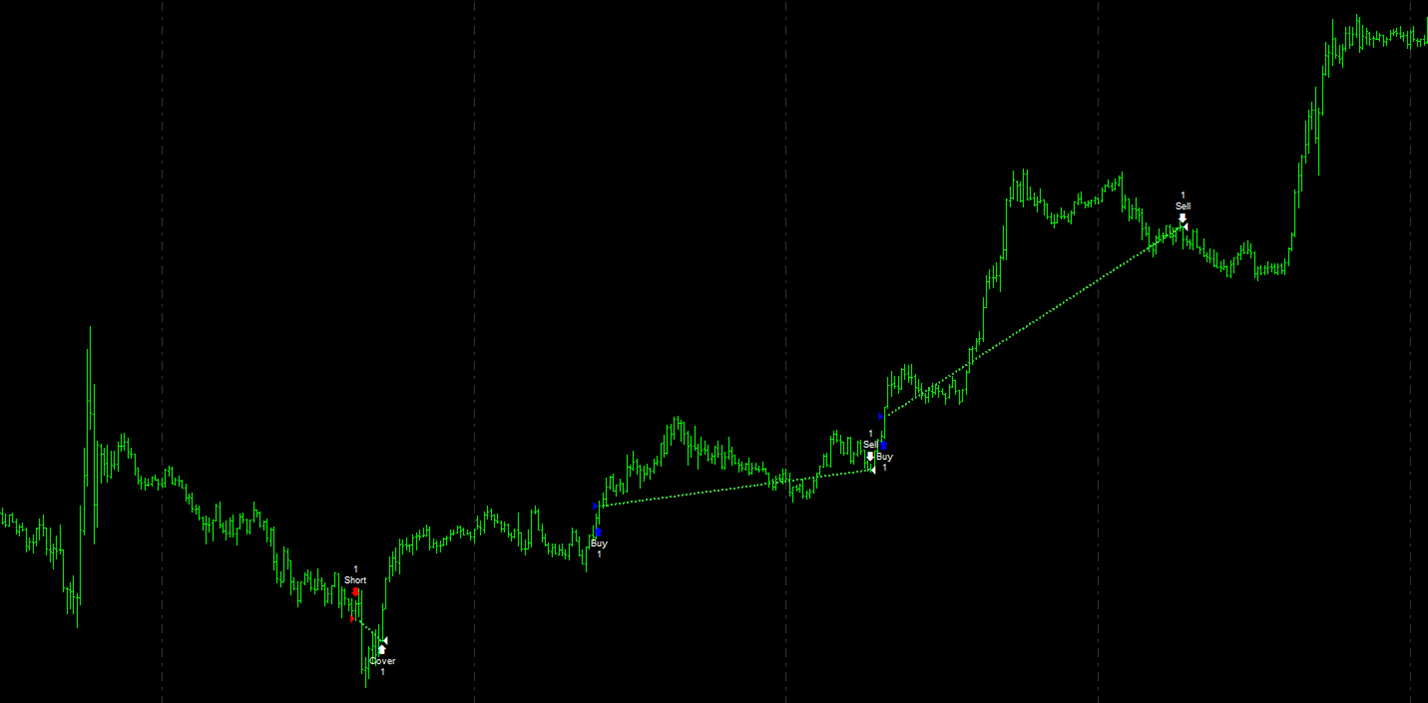
- Long entries are triggered when the price breaks above the second standard deviation calculated on the linear regression line.
- Short entries work the same way, but in reverse, waiting for a break below the negative second standard deviation (see Figure 1).
You could think of these levels as a kind of Bollinger Bands, but instead of being calculated on the closing price, they’re derived from the value of the regression line itself.
The strategy runs on a 60-minute time frame, which helps filter out the “noise” found in shorter intervals, like 5-minute or 1-minute charts, which we know are often too fast for effective indicator-based analysis.
Strategy Results with Linear Regression: +$70,000 in 9 Months
As shown in the figures below, this strategy has been performing exceptionally well, particularly over the past year.
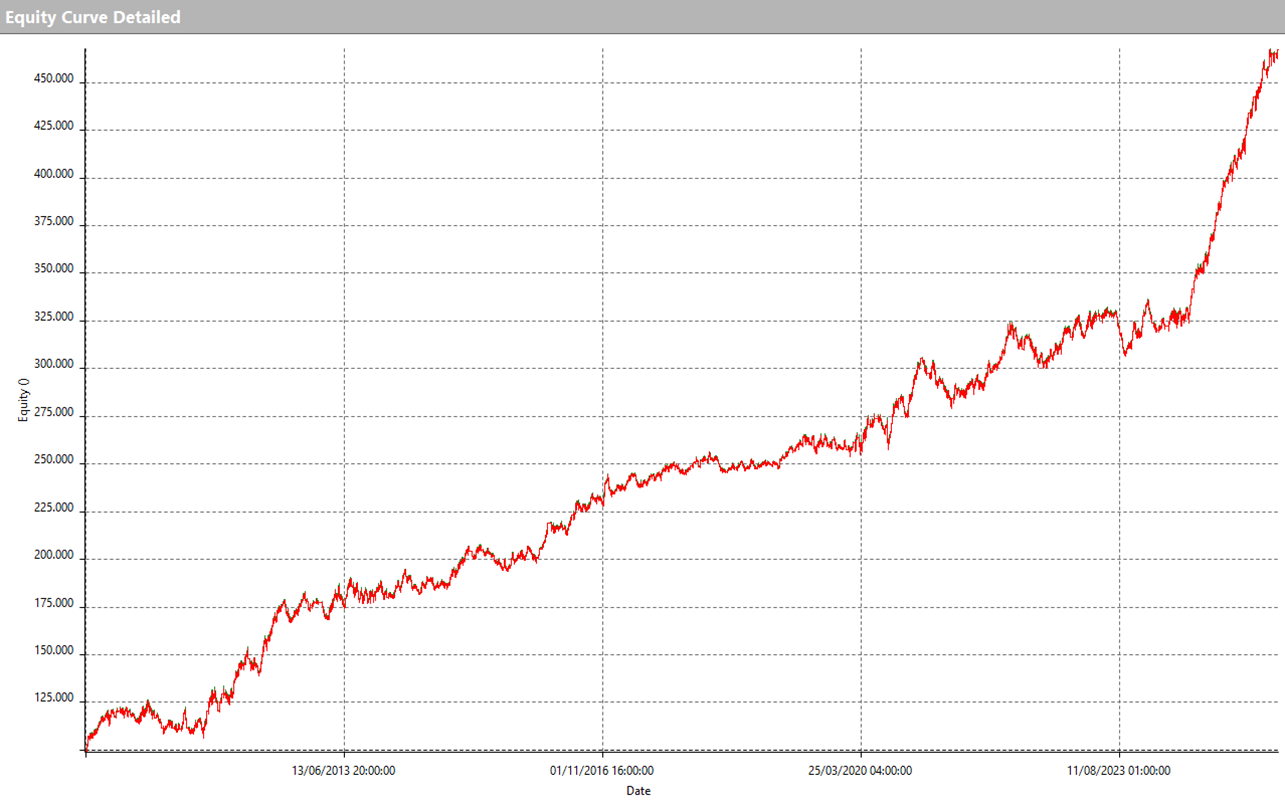
From the beginning of 2025 through September, the system has already generated more than $70,000 in profits. An impressive result, especially considering these gains were achieved using just one contract per trade.
As mentioned in the introduction, it’s also possible to scale down risk exposure by trading the Micro Gold contract (MGC). In doing so, both profits and risks would be proportionally lower, exactly one-tenth of the results shown here, which are based on the standard contract.
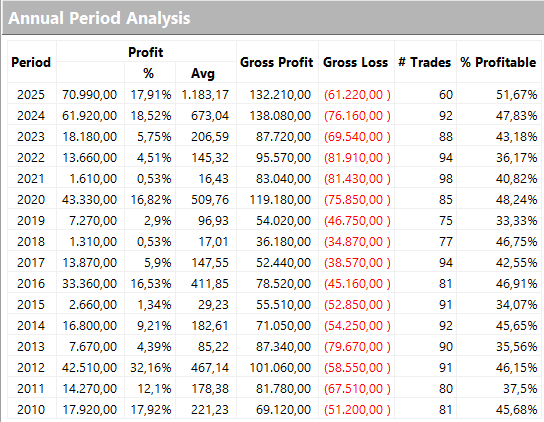
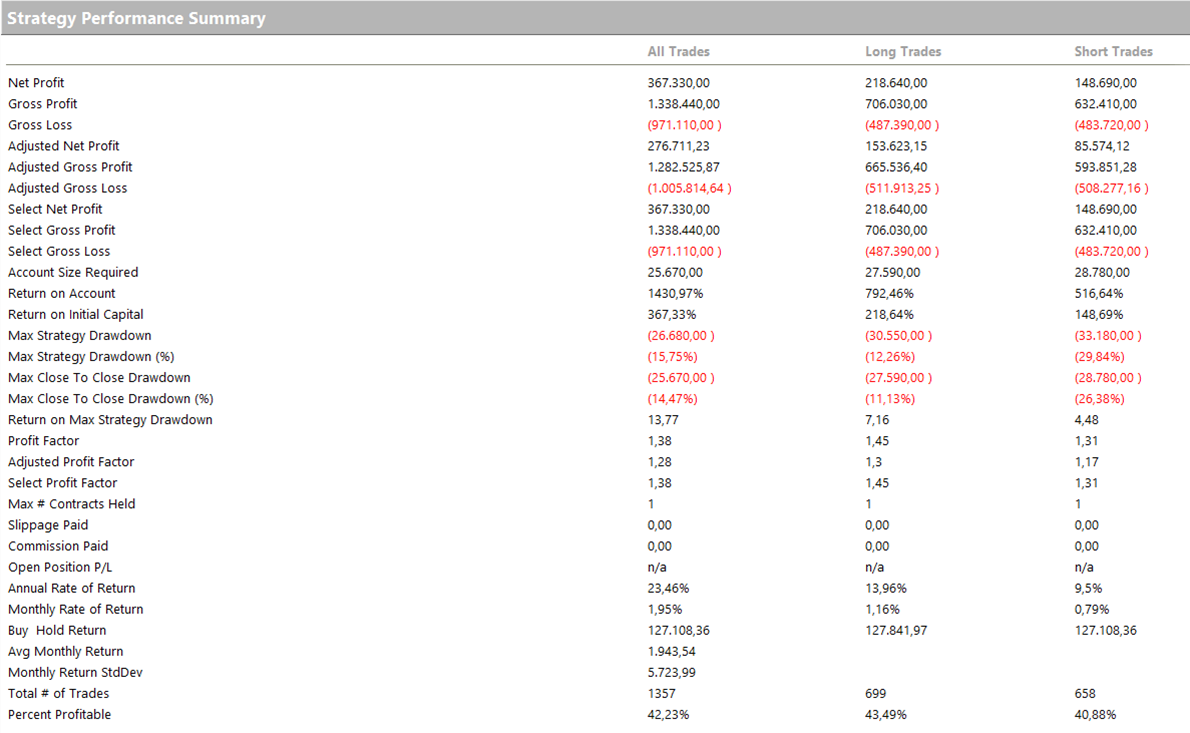
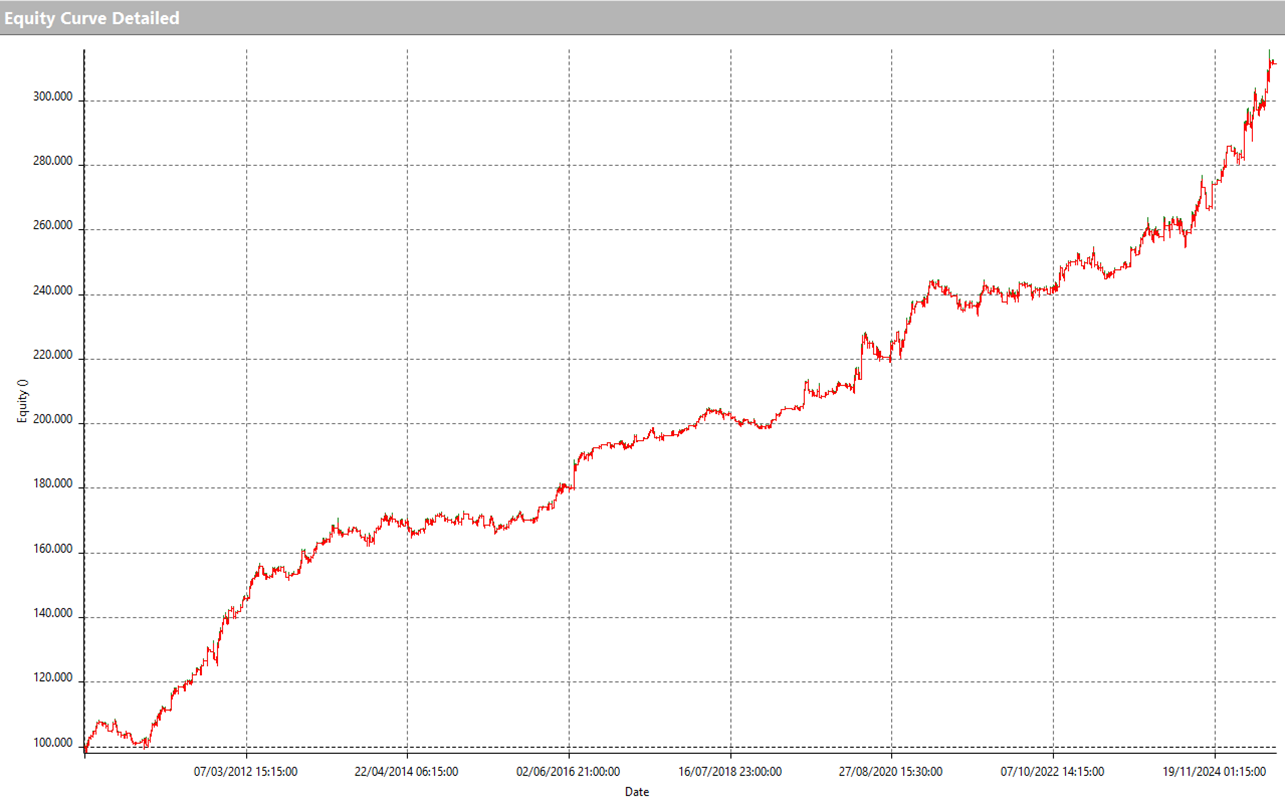
The equity curve since 2010 shows consistent growth over time, totaling approximately $367,000 in profit, with a maximum drawdown of $26,700. These are outstanding results—although, as with any investment or trading system, they naturally involve a degree of risk.
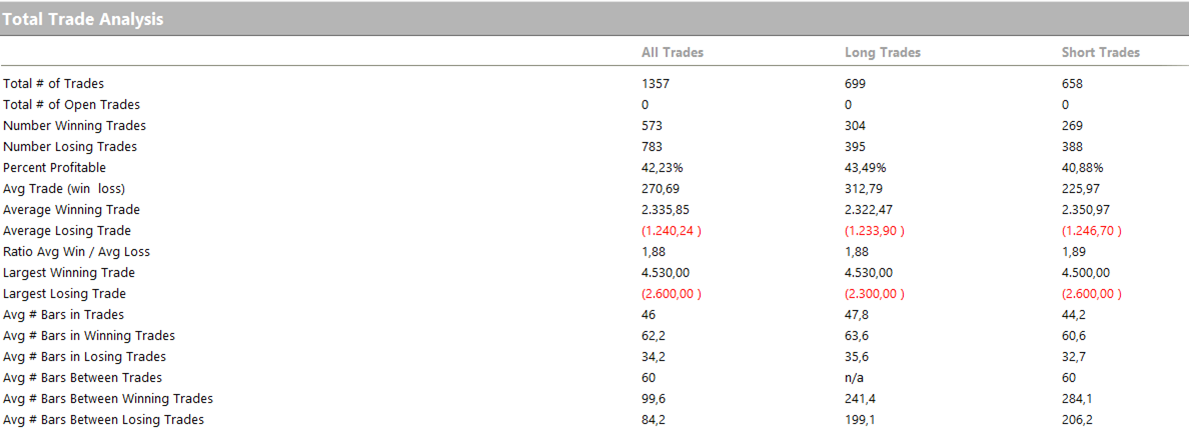
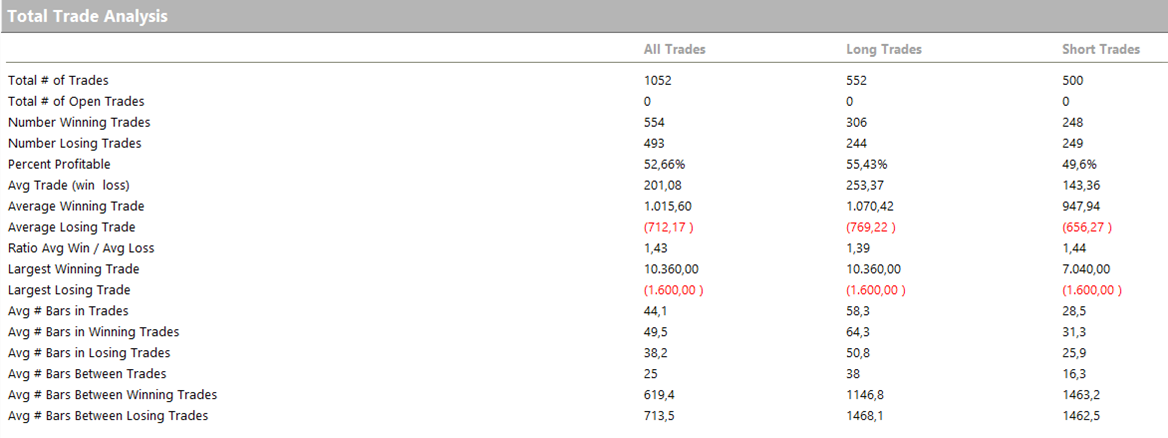
The average profit per trade is also very strong, coming in at approximately $270, or about 27 ticks, which is the minimum price movement for this market. This generous average helps protect against future slippage and commission costs.
Strategy 2: Post-Compression Breakout, Strength After the Calm
The second strategy we’ll discuss is also based on a trend-following approach. In fact, we covered this system about a month ago, and we’re pleased to report that it continues to deliver outstanding profits week after week.
Let’s start with the rules. This strategy waits for what’s known as a compression day—a day marked by low volatility and lack of direction, often seen as a sign of market indecision. The underlying idea is that such days are often followed by more directional moves, which the strategy aims to capture.
- Long entries: Buy orders are placed at the highest high of the past 80 bars on a 15-minute chart.
- Short entries: Sell orders are placed at the lowest low of the past 80 bars, forming the opposite side of the channel.
The strategy exits trades at precisely defined times, which differ for long and short positions. Long positions are closed at midnight (New York Exchange time) following the entry day, while short positions are closed at 10:00 AM (Exchange time) the next day.
This Strategy Keeps Delivering: +$33,000 Since January 2025
Looking at the performance charts below, we can see consistently positive results. Once again, the most notable takeaway is the strong profitability seen in 2025: from January to September alone, the strategy has already generated over $33,000 in profits—an increase of $11,000 since the last time we reviewed this system.
The equity curve since 2010 is smooth and upward-trending, showing approximately $211,000 in total profits with a modest maximum drawdown of $11,500. Truly a solid result.
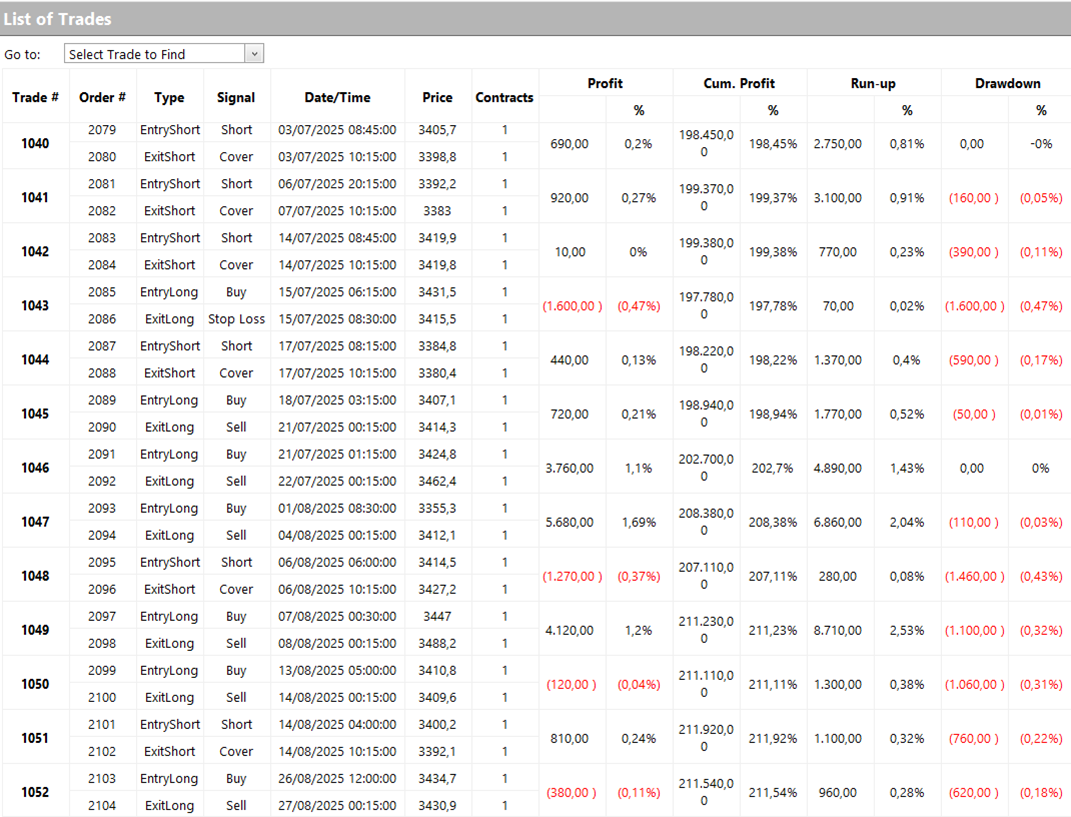
The average trade value is also very strong, currently around $200 per trade, up $10 in just the last month thanks to a highly profitable streak of recent trades (see Figure 11).

Gold Shines in 2025: Momentum Remains Strong, and Systematic Strategies Are Capitalizing
Gold continues to hit record highs and generate solid profits in 2025. After two years of sustained growth, the precious metal remains a highly dynamic asset. Factors such as increased demand from central banks, geopolitical uncertainty, and the global search for safe-haven assets have all contributed to elevated volatility.
In this environment, trend-following systems have been particularly effective, turning price swings into real, actionable opportunities.
The momentum built up in recent months continues to fuel our systems, and all signs suggest that gold could remain a key player through the end of the year.
If your goal is to build robust and efficient trading strategies, we invite you to learn more about our method and book a free consultation with one of our experts by clicking the button below.
Happy Trading!


