
Welcome back to a new installment of our portfolio strategy analysis. Today, we’ll focus on two US indexes which, although both part of the broader family of equity indices, display very different characteristics: the Dow Jones Industrial Average (YM), the ultimate symbol of US finance and a benchmark par excellence, and the S&P MidCap 400 (EMD), which represents mid-cap companies—often more dynamic and volatile compared to large-cap stocks.
The common thread in the strategies we’ll present today is trend following, an approach based on the idea of following the market’s direction instead of trying to anticipate it. However, the two trading logics we’ll examine have been developed with different criteria, specifically tailored to the unique features of their respective indexes.
In recent months, both markets have provided interesting opportunities, with phases of strong price acceleration that highlighted the strengths of systems based on trend-following principles, though implemented with different setups.
Ready? Let’s dive into the details.
Strategy 1 – Trend Following on the Dow Jones Industrial Average
The first strategy we’ll examine today was developed on the Dow Jones (YM) futures contract. This is a trend-following strategy, as explained earlier, designed to capture directional market moves by filtering signals through well-defined patterns and time-based conditions.
In short, the system identifies the most promising phases of the trading day, opening long positions near the breakout of the previous session’s high. As for short positions, these are opened at the previous session’s lows, with an additional number of ticks applied to achieve more efficient entries.
Positions have a limited holding period of a specific number of days. The strategy also integrates classic money management tools—such as stop loss, take profit, and breakeven levels—that help control risk and protect profits.
Figure 1 shows a concrete example of trades generated by the system.

Performance of the Trend-Following Strategy on the Dow Jones
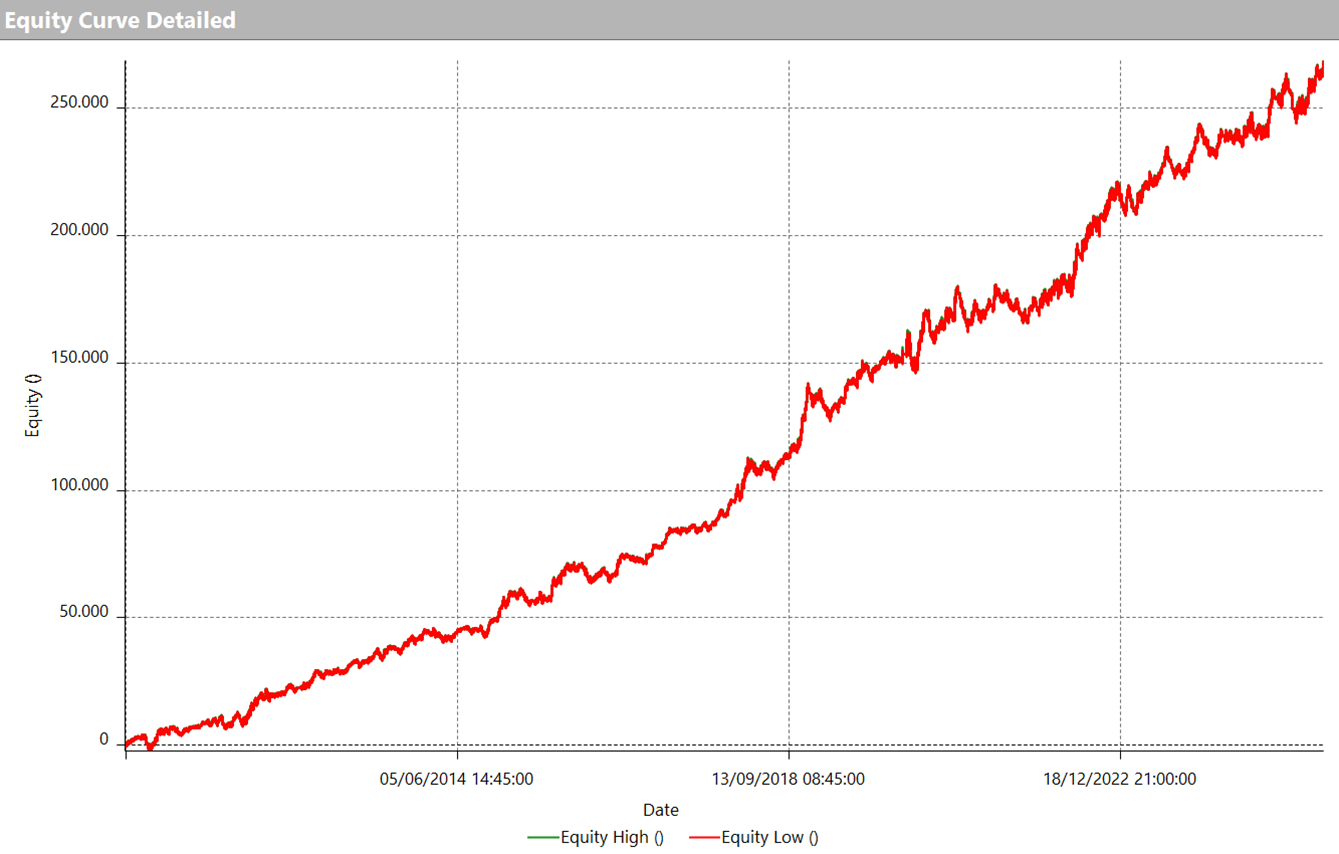
Turning to performance analysis, what stands out immediately is the remarkable consistency of the equity line (Figure 2).
Over the past ten years, the system has demonstrated steady growth without ever facing prolonged drawdown phases. The equity curve highlights a strong ability to adapt to different market conditions.
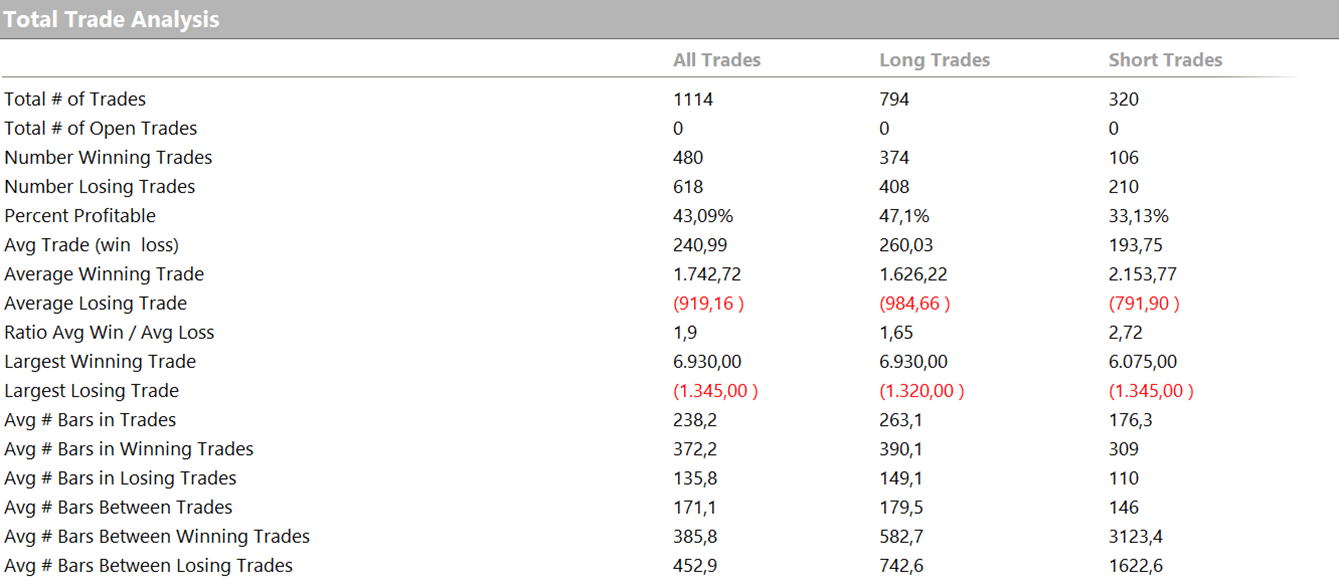
Looking at the Total Trade Analysis data (Figure 3), several interesting points emerge:
- The average trade is around $241, a value more than sufficient to cover slippage and commissions, ensuring the strategy’s applicability in live trading.
- The percentage of winning trades is 43%, which may seem modest but is fully consistent with trend-following logic, where a few large profitable trades offset numerous small losses.
- Even short trades, despite having a lower win rate (33%), still maintain a positive average trade of around $194, making a significant contribution to the overall stability of the system.
Overall, the combination of a steady equity line, strong average trade values, and effective drawdown management makes this Dow Jones strategy an excellent example of a robust, real-world trading approach.
Strategy 2 – Trend Following on the S&P 400 MidCap Index
The strategy developed on the S&P 400 MidCap (EMD) works on a 5-minute timeframe and focuses on the early stages of the US session, between 8:30 and 10:30 a.m. (Chicago time). This time window typically features the highest levels of liquidity and volatility, creating ideal conditions to identify and capture well-defined directional moves.
The entry signal is generated by observing the first bar of strength or weakness:
- If the bar shows buying pressure, the system evaluates a long entry.
- If selling pressure prevails, a short entry is considered.
These conditions are combined with specific patterns that help filter out false signals and select only the most profitable contexts.
Trades are always closed by 3:00 p.m., even in the absence of stop loss or profit target exits, to avoid remaining exposed during less liquid and more unpredictable market phases.
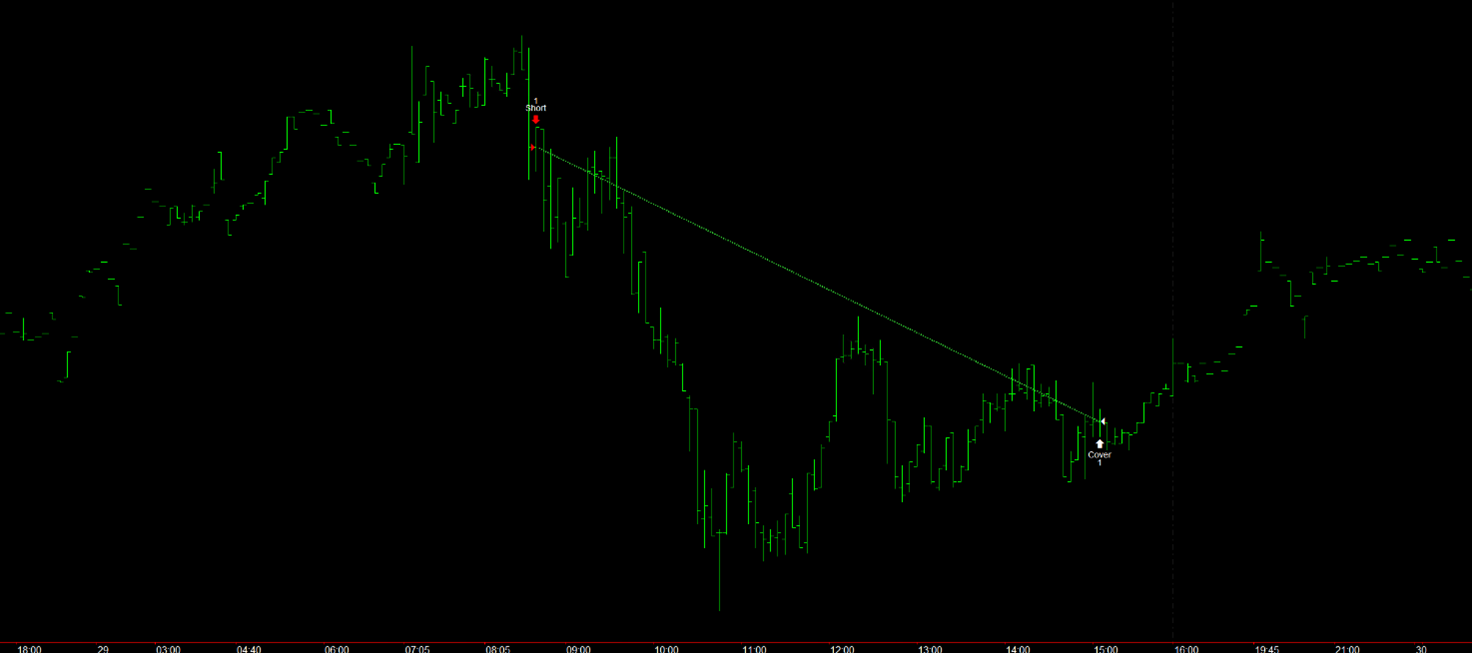
Figure 4 shows an example of a short trade: after an opening bar of weakness, the system quickly enters the market and rides the subsequent bearish acceleration, with a forced exit later in the afternoon.
Performance of the Strategy on the S&P 400 MidCap
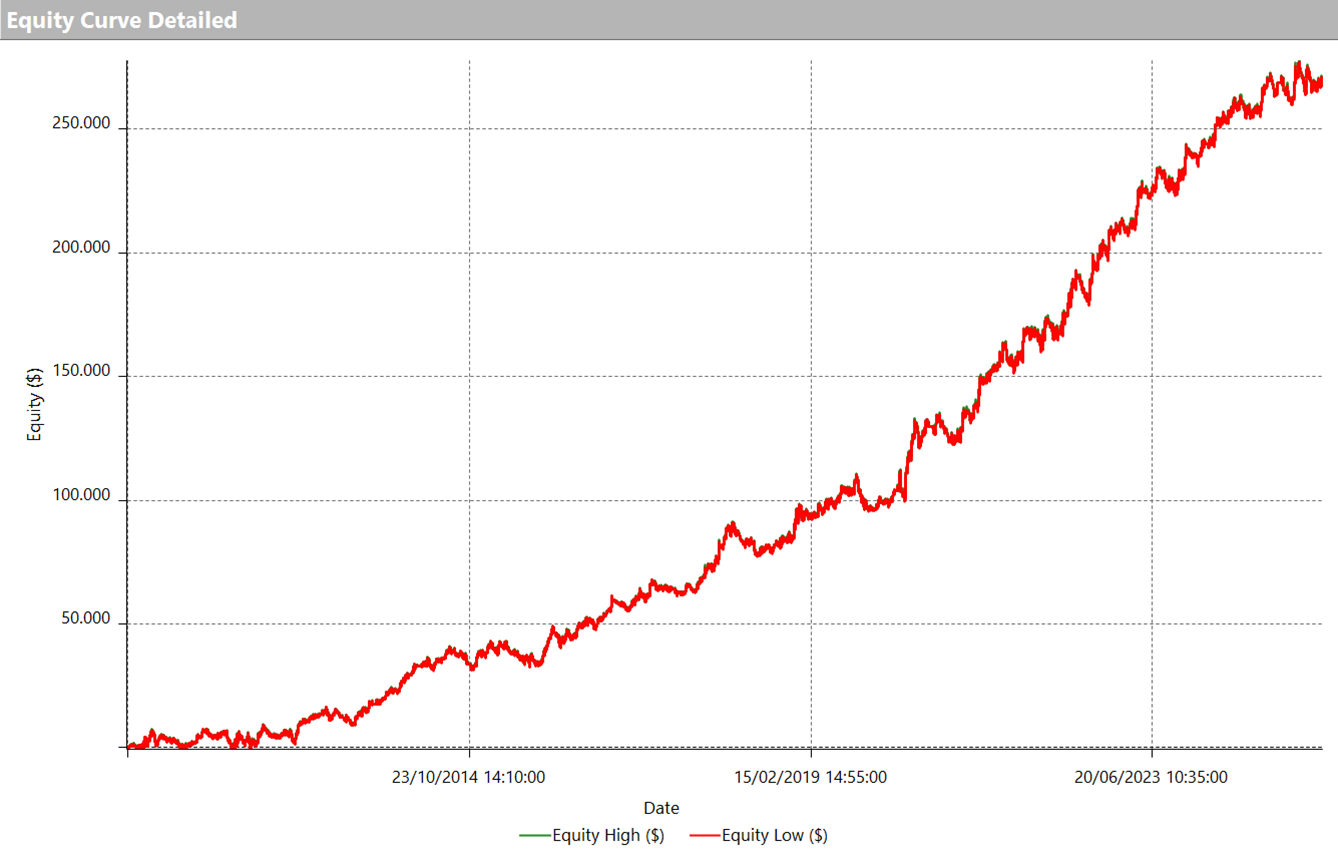
The equity line of the strategy (Figure 5) shows a very steady and convincing trajectory: growth has remained consistent over more than ten years, with a smooth progression and no particularly prolonged drawdowns. Especially striking is the most recent phase, where the curve has continued to reach new all-time highs, confirming the robustness of the system across different market environments.
Looking more closely at the Total Trade Analysis (Figure 6), several key points stand out:
- The average trade is around $153. While lower than the figure observed on the Dow Jones strategy, it is still sufficient to cover slippage and commissions, making the system suitable for live trading.
- The win rate is 43.8%, very close to that of the Dow Jones strategy and consistent with trend-following logic, where a handful of large winning trades offset numerous smaller losses.
- Results are balanced between directions: long trades average about $187, while short trades—more frequent in this case—average $123. Both, however, contribute meaningfully to the overall consistency of the system.
Overall, the combination of a solid equity line, a stable average trade, and a well-balanced risk/reward profile makes this strategy an excellent example of trend following tailored to a mid-cap equity index, capable of delivering consistent performance over time.

Equity Trading: Trend Following on Dow Jones and S&P 400 MidCap
In this review, we explored two examples of trend-following trading strategies applied to the equity market. Both proved to be effective, with robust equity lines and long-term stability.
The distinctive feature of this study lies in the choice of underlying assets: not the classic S&P 500 or Nasdaq, but two futures less commonly traded—the Dow Jones and, above all, the S&P 400 MidCap. The latter, in particular, often overlooked by most traders, has proven capable of offering very interesting opportunities thanks to its volatility and concentrated liquidity in the early hours of the session.
We hope you found this article useful and that it serves as inspiration for discovering new ideas to leverage in your equity trading.
If your goal is to build robust and efficient trading strategies, we invite you to explore our method further and book a free call with one of our experts. Until next time!


