
Welcome to a new installment in our article series, where we take a closer look at two standout strategies from our database. Both systems trade one of the most important commodity futures contracts: Gold Futures (@GC). The first strategy has been out-of-sample since 2018, while the second one went live about a year ago.
As always, we’ll break down the general logic behind these systems and, more importantly, examine their current performance. The goal? To offer you valuable insights and inspiration for developing new trading systems on this highly traded underlying asset—which often plays a key role in a systematic trader’s portfolio.
Strategy No. 1: Multiday Trend-Following on Gold – Breakout of Highs and Lows
This first strategy trades on a 5-minute time frame and follows a trend-following logic based on classic breakouts of the current session’s high and low. Importantly, this breakout must occur within a specific time window a few hours after the 6:00 PM (Exchange time) session open.
Since this is a multiday strategy, positions can remain open for multiple sessions.
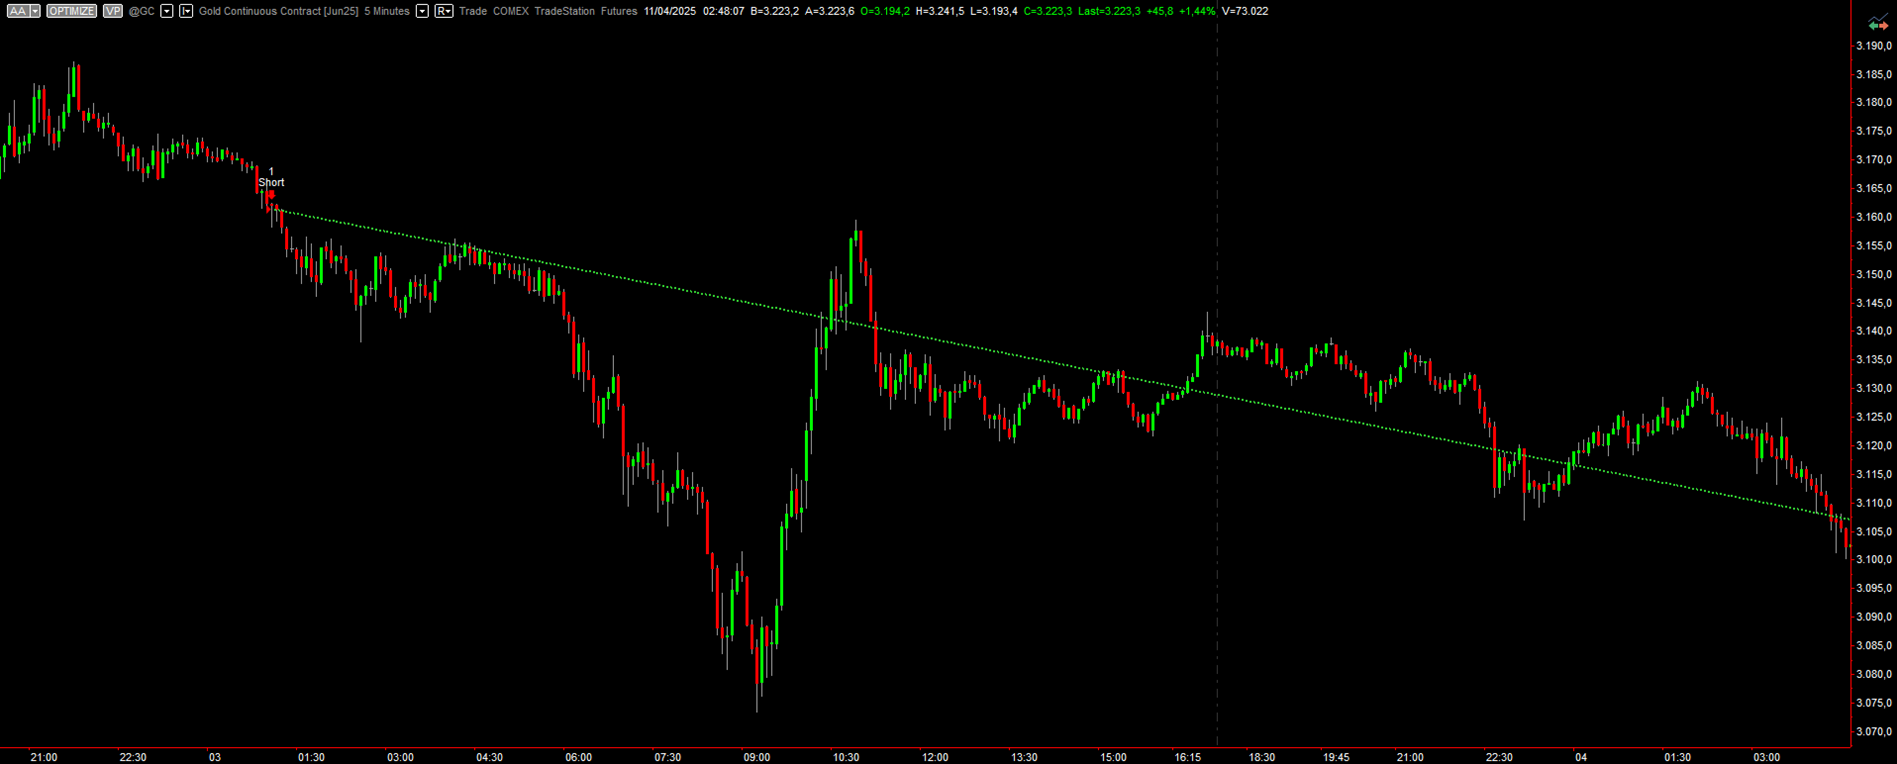
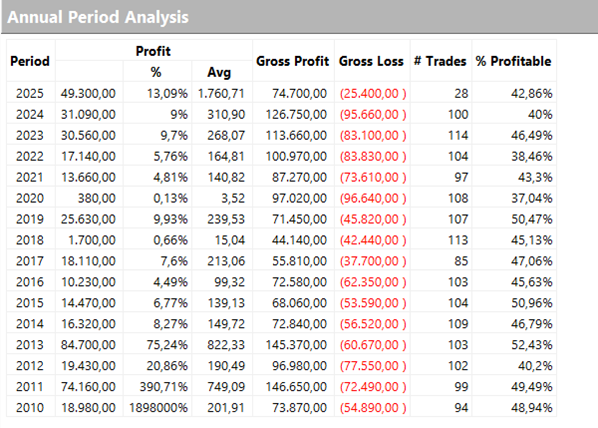
Figure 1 – Example trade executed by the multiday trend-following strategy (high/low breakout) on Gold Futures.
Below, we can see the impressive consistency of the equity curve over the full historical period from 2010 to today. In particular, the performance in the past year—and especially in 2025—has been extraordinary, with a strong run-up that brought total profits to nearly $50,000 (precisely $49,300).
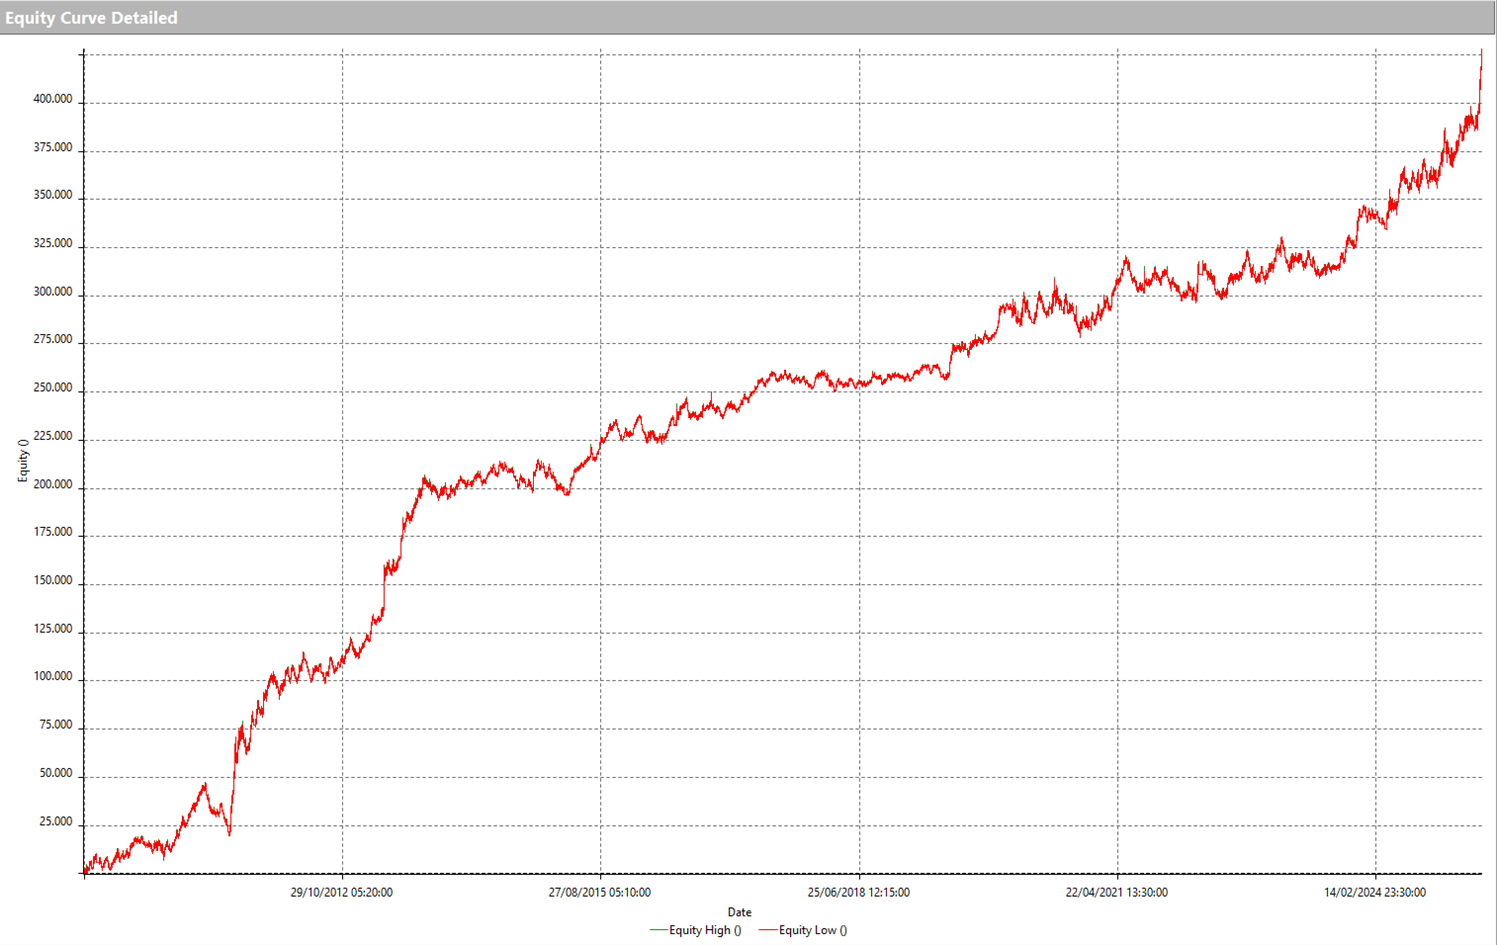
Figure 2 – Equity line for the multiday trend-following strategy (high/low breakout) on Gold Futures.
The Performance Summary shows a balanced distribution of profits between long and short trades, with long trades performing better—clearly benefiting from the strong bullish trend in gold in recent months.
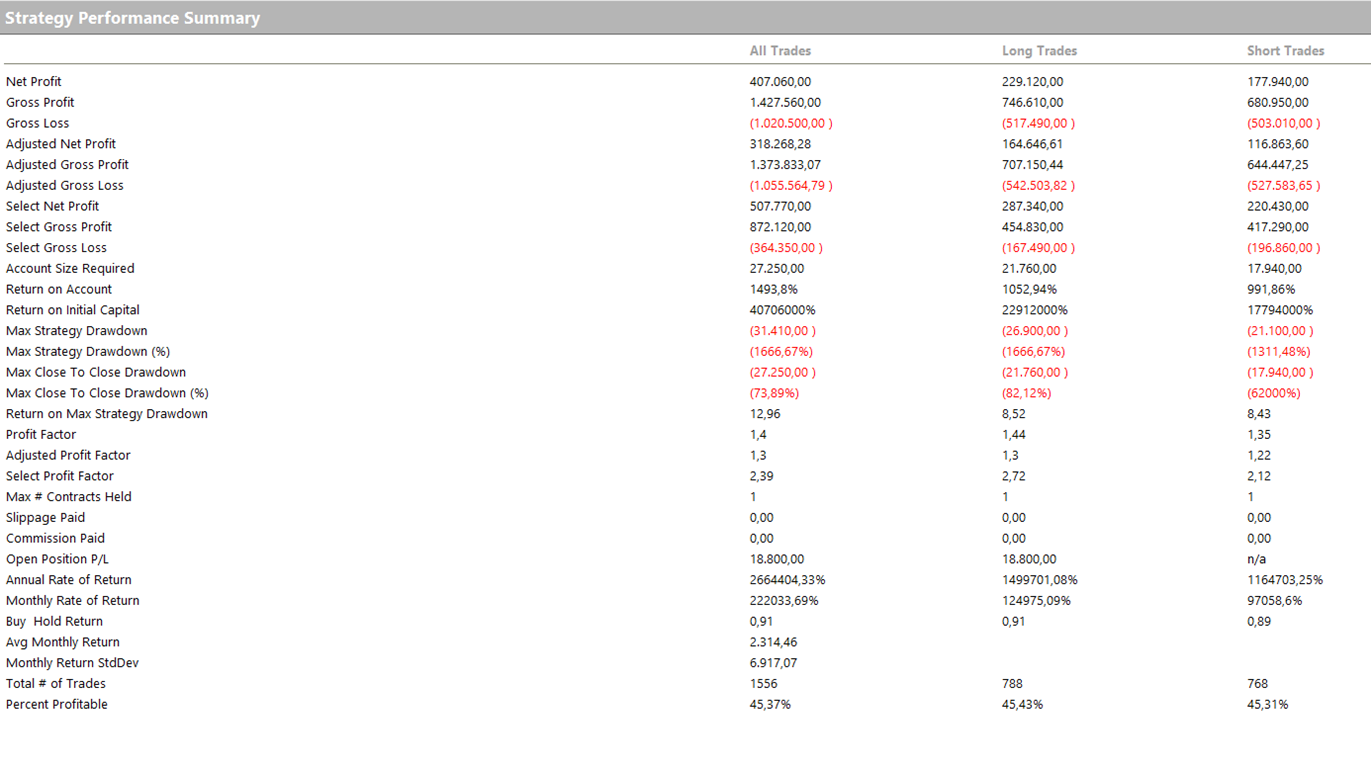
Figure 3 – Strategy Performance Summary for the multiday trend-following strategy (high/low breakout) on Gold Futures.
The average trade exceeds $260, a strong result that easily covers trading costs.
As always, we highlight the option to trade the Micro Gold contract (MGC) as an alternative, which has a value of 1/10 compared to the standard @GC contract.
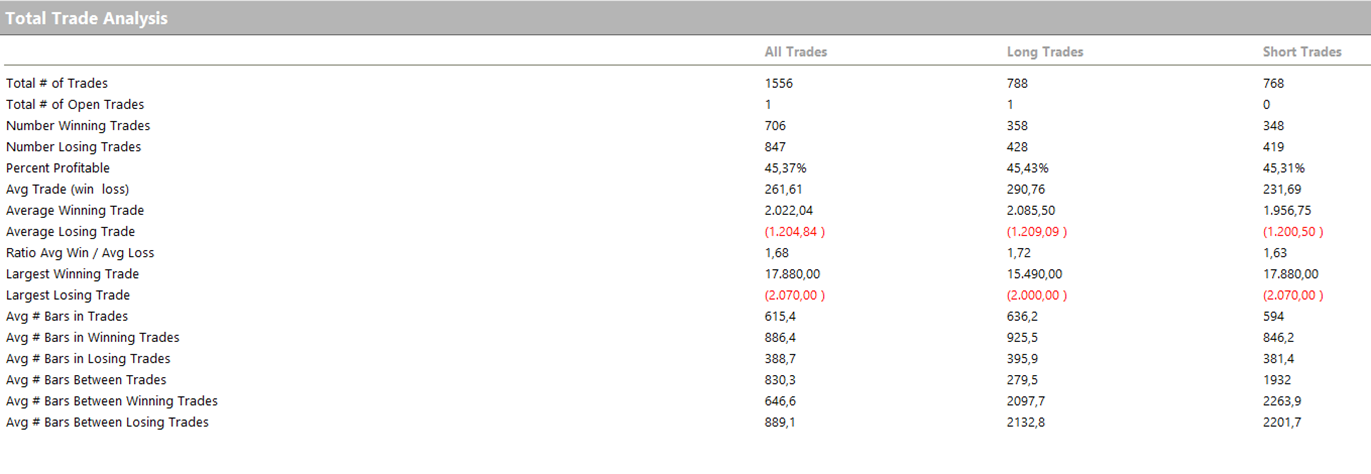
Figures 4 – Trade analysis for the multiday trend-following strategy (high/low breakout) on Gold Futures.
Figures 5 – Yearly performance breakdown for the multiday trend-following strategy (high/low breakout) on Gold Futures.
Strategy No. 2: Multiday Trend-Following on Gold – Breakout of a Price Channel
The second strategy also uses a 5-minute time frame and follows a trend-following logic. This system enters trades based on a price channel built from the highs and lows over a defined number of periods.
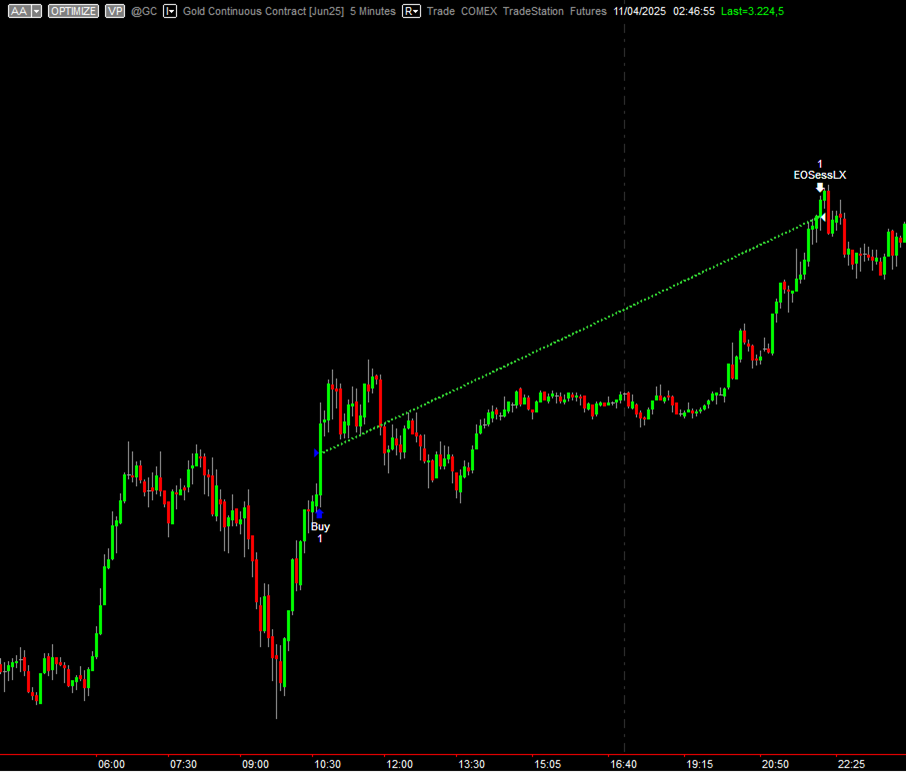
Figure 6 – Example trade from the multiday trend-following strategy (price channel breakout) on Gold Futures.
In this case as well, pattern-based filters have been added to the base logic with the goal of increasing the average trade and filtering out unprofitable setups.
Let’s take a look at performance starting with the equity curve. It’s remarkably stable throughout the historical period, without major spikes or slumps—an important factor when considering portfolio integration.
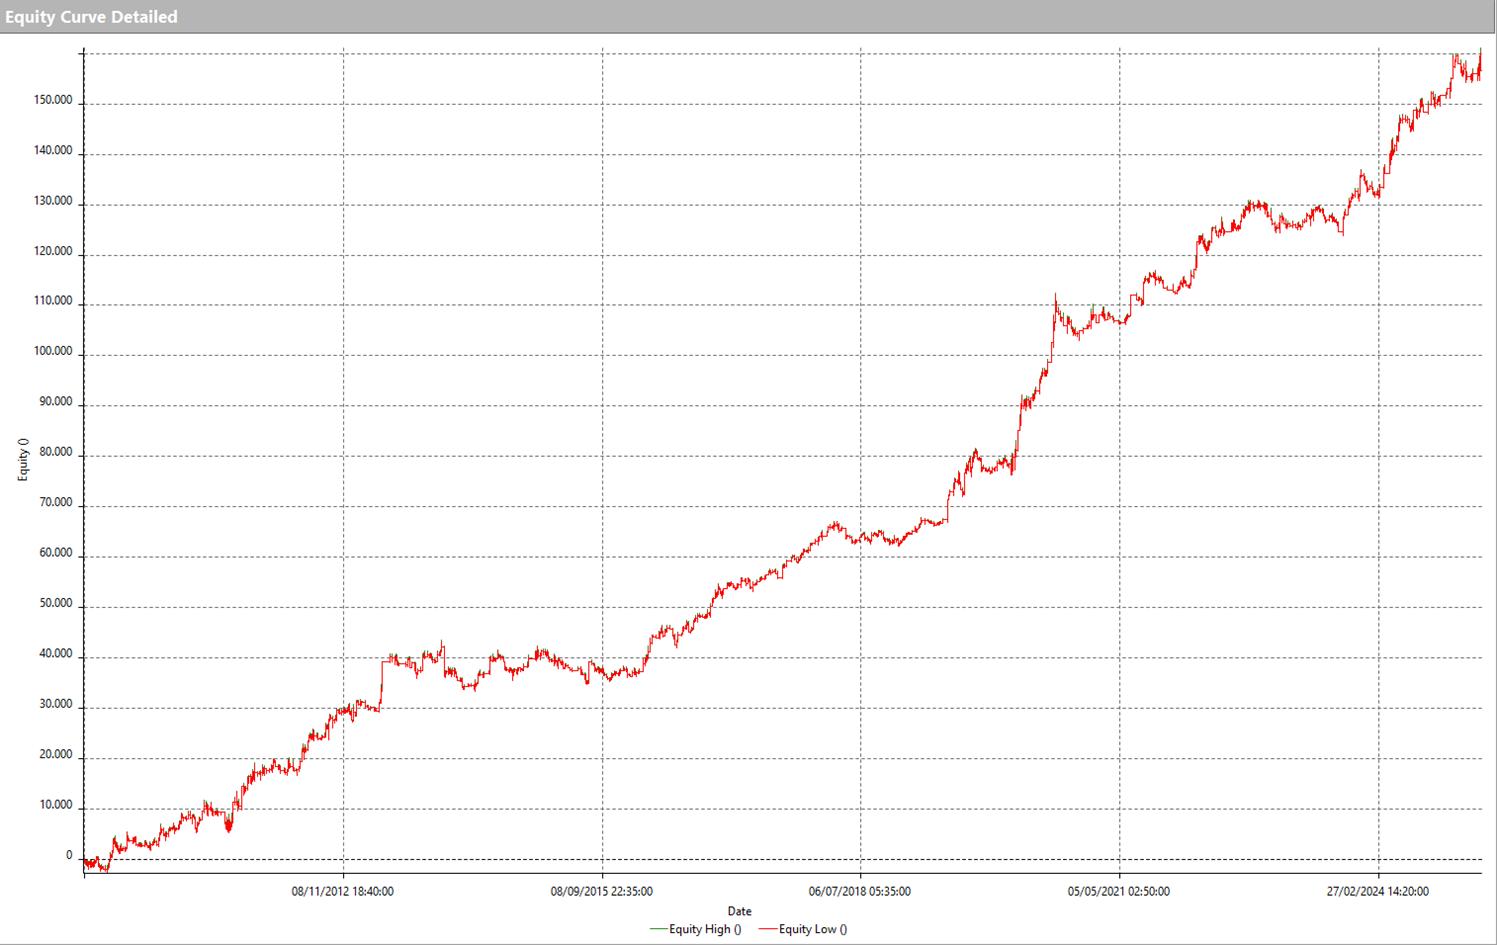
Figure 7 – Equity curve of the multiday trend-following strategy (price channel breakout) on Gold Futures.
In terms of overall performance, this strategy earns less than the first one but does so in a more consistent manner. The maximum drawdown is limited to just $10,000, and the Return on Max Drawdown reaches 15.38, which is an excellent risk/reward indicator.
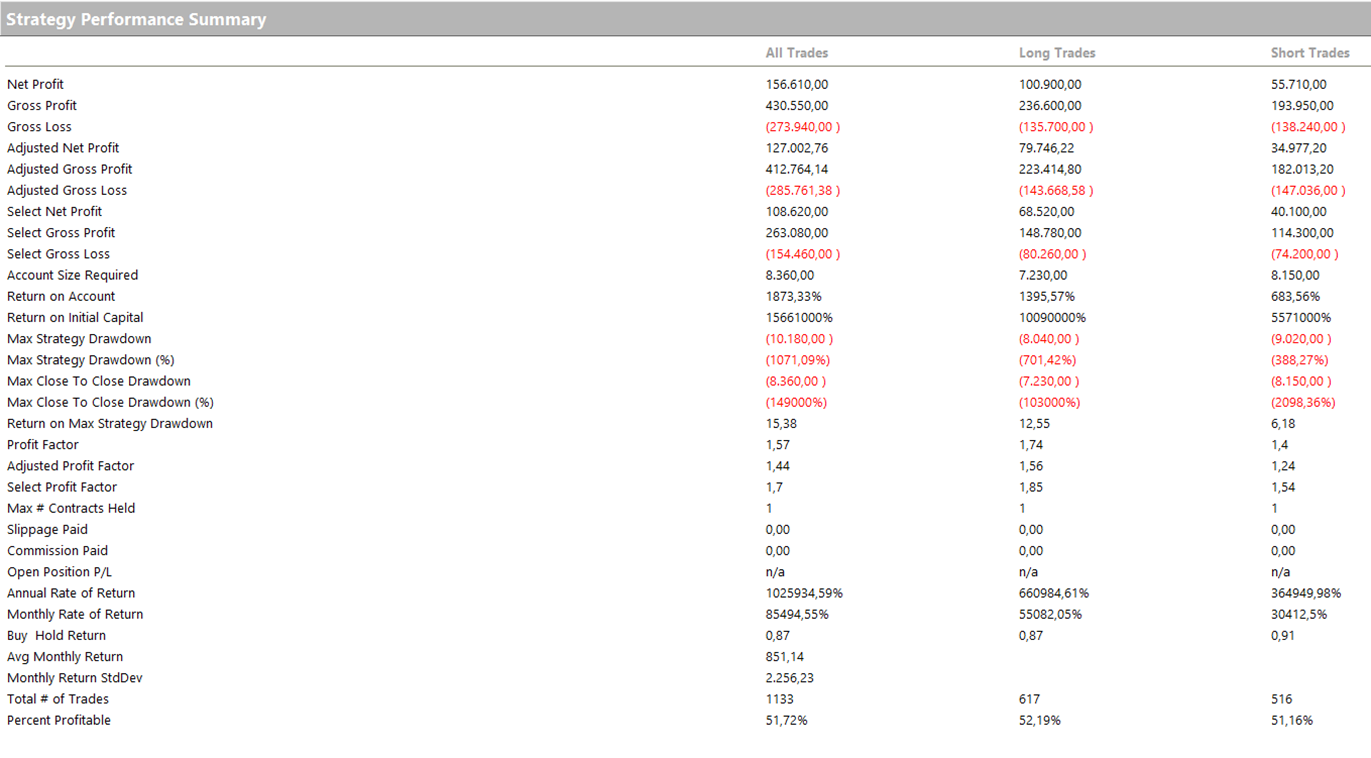
Figure 8 – Strategy Performance Summary for multiday trend-following strategy (price channel breakout) on Gold Futures.
The average trade comes in at nearly $140—lower than the first strategy, but still strong for this type of trading system and market.
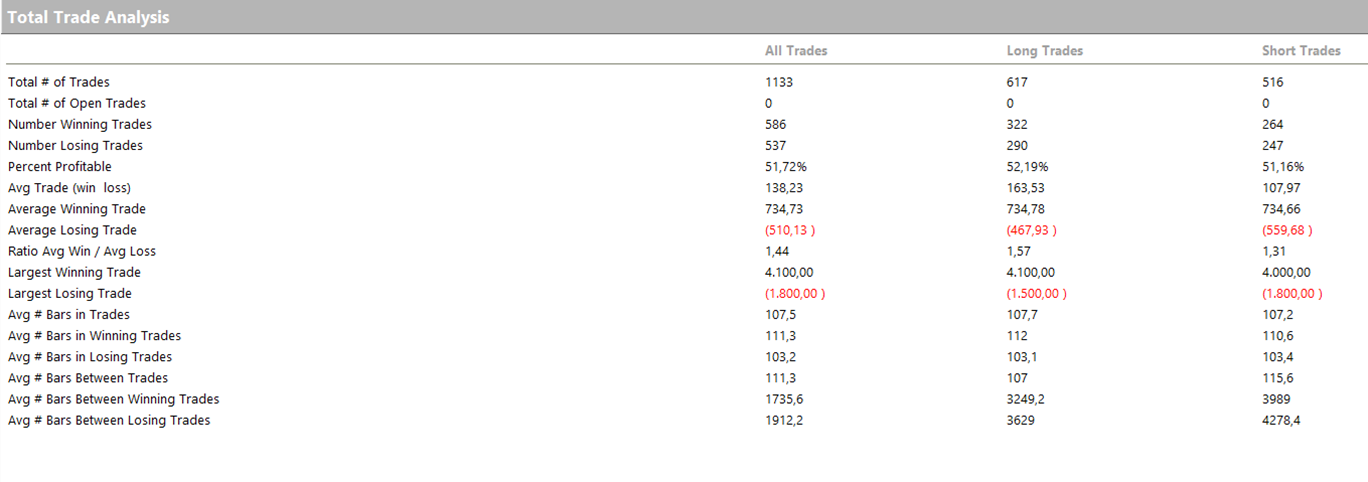
Figure 9 – Total Trade Analysis for the multiday trend-following strategy (price channel breakout) on Gold Futures.
Final Thoughts on These Two Multiday Trend Following Strategies on Gold Futures
The two systems we’ve analyzed here represent robust, profitable, and well-structured approaches to trading Gold. The first one relies on a classic breakout method and has delivered nearly $50,000 in profits in just a few months. The second stands out for its consistent equity curve and excellent drawdown control.
Naturally, no system—regardless of how well it’s built—can guarantee constant profits or totally eliminate risk. What truly makes a difference in the long run is the quality of the method, the ability to adapt to market conditions, and a solid risk and capital management plan.
Want to Learn More?
It could be your first concrete step toward transforming your approach to trading.
Until the next analysis—happy systematic trading to all!


