
In this article, we take a deep dive into two systematic trading strategies focused on the energy futures markets, specifically Crude Oil and RB Gasoline. Both strategies follow a trend-following approach and are designed to operate on a 15-minute timeframe.
Before getting into the strategy mechanics, it’s important to highlight a key point: energy futures markets, particularly Crude Oil and RB Gasoline, have proven to be especially challenging for automated strategies in recent years. These markets have often exhibited low directional movement, irregular price action, and frequent volatility shifts, conditions that can put even the best trend-following systems to the test.
Despite this, the goal of this article is hands-on and practical: to evaluate the recent performance of two clearly defined automated strategies and provide a snapshot of how they performed in 2025. We’ll explore historical data, equity curves, performance metrics, and the consistency of results to see when and how these systems were able to capture market trends.
So, if you’re looking to apply trend-following techniques to energy futures, or you want real-world examples of automated trading strategies for Crude Oil and RB Gasoline, you’re in the right place.
Strategy #1 – Crude Oil: Trend Following with Optimized Moving Averages
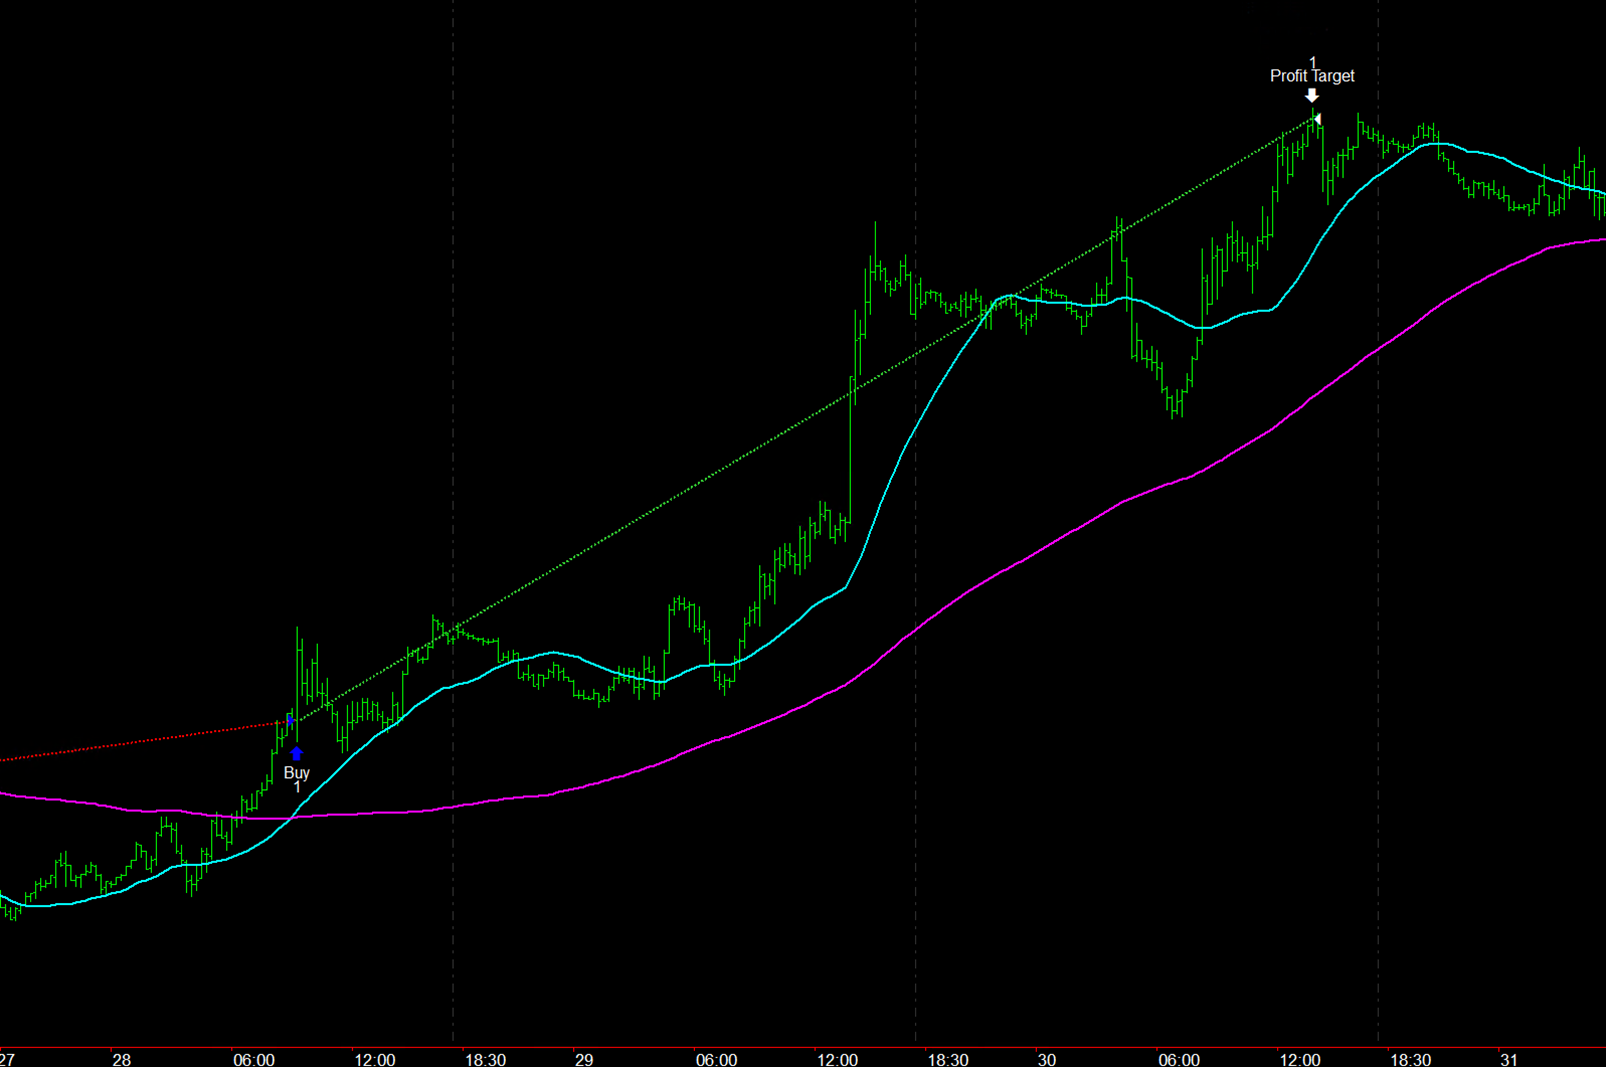
The first strategy, applied to Crude Oil, is based on one of the most classic technical analysis rules: the crossover between a fast and a slow moving average. The concept is simple: when the fast moving average crosses above the slow one, it indicates that price momentum is building and a new directional move may be underway.
Conversely, when the fast average crosses below the slow one, it’s a potential signal of weakening momentum and the start of a pullback or trend reversal.
Here’s how the strategy operates on a 15-minute timeframe:
- It enters long trades when the fast MA crosses above the slow MA;
- It enters short trades when the fast MA crosses below the slow MA;
- Trade exits are managed not only with opposing signals, but also with stop loss and take profit levels.
The specific parameters used are a 30-period fast MA and a 140-period slow MA. These aren’t random or default settings found on most platforms; they’ve been optimized and validated specifically for this market and timeframe.
Figure 1 shows a real example of how the strategy works, including the entry, trade management, and the use of a profit target alongside a stop loss, forming a complete and robust strategy structure.
How Does the Crude Oil Strategy Perform? Equity Curve and Key Metrics
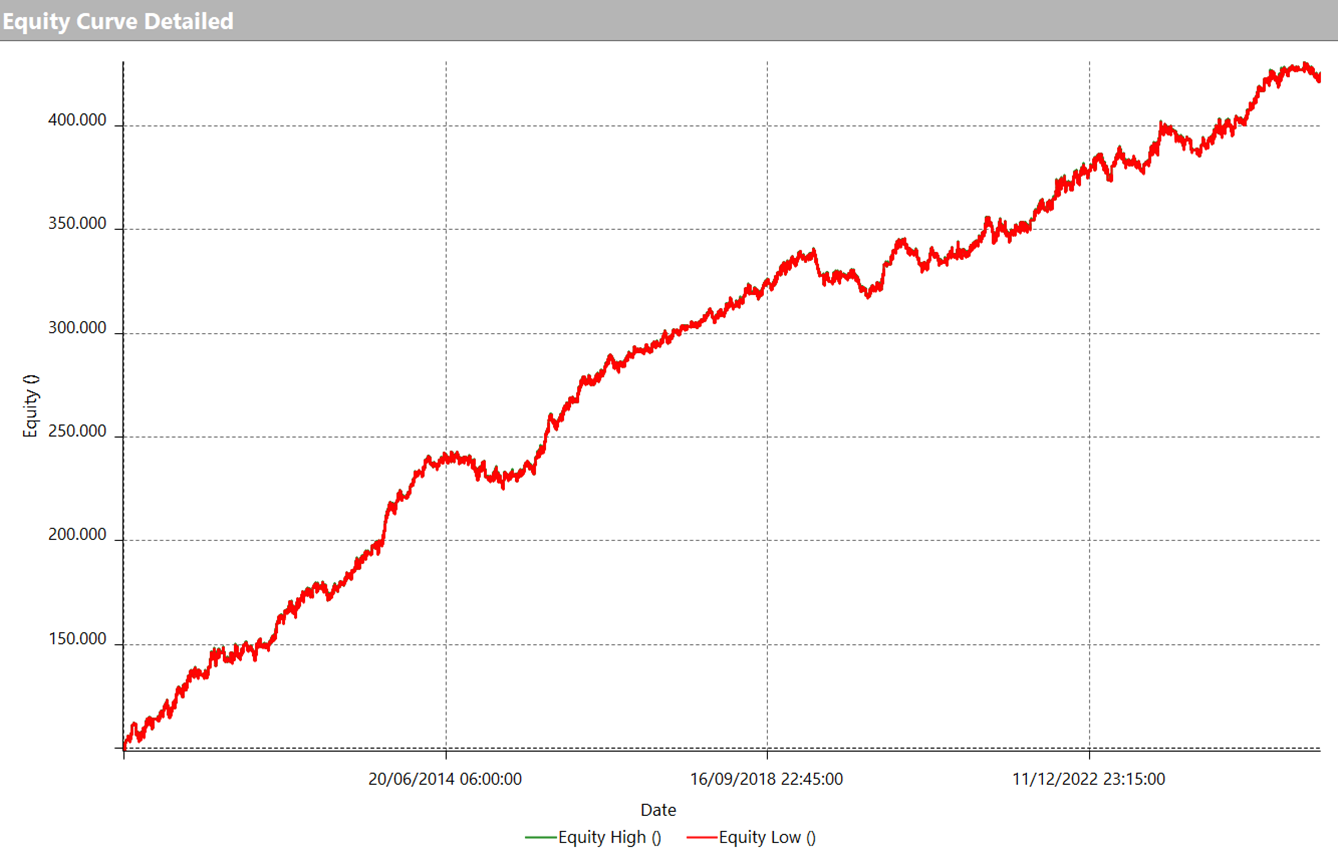
Looking at the results, the equity curve immediately stands out. As shown in Figure 2, the strategy displays steady growth over time, with natural pauses and drawdowns, but no major collapses or long-lasting downturns.
This is particularly notable given that Crude Oil has experienced erratic phases in recent years, often switching between sharp directional moves and choppy sideways action.
Despite the less-than-ideal market environment, the equity line has remained solid and continued to perform well, even in the most recent periods.
Crude Oil: Detailed Stats and Yearly Returns Through 2025
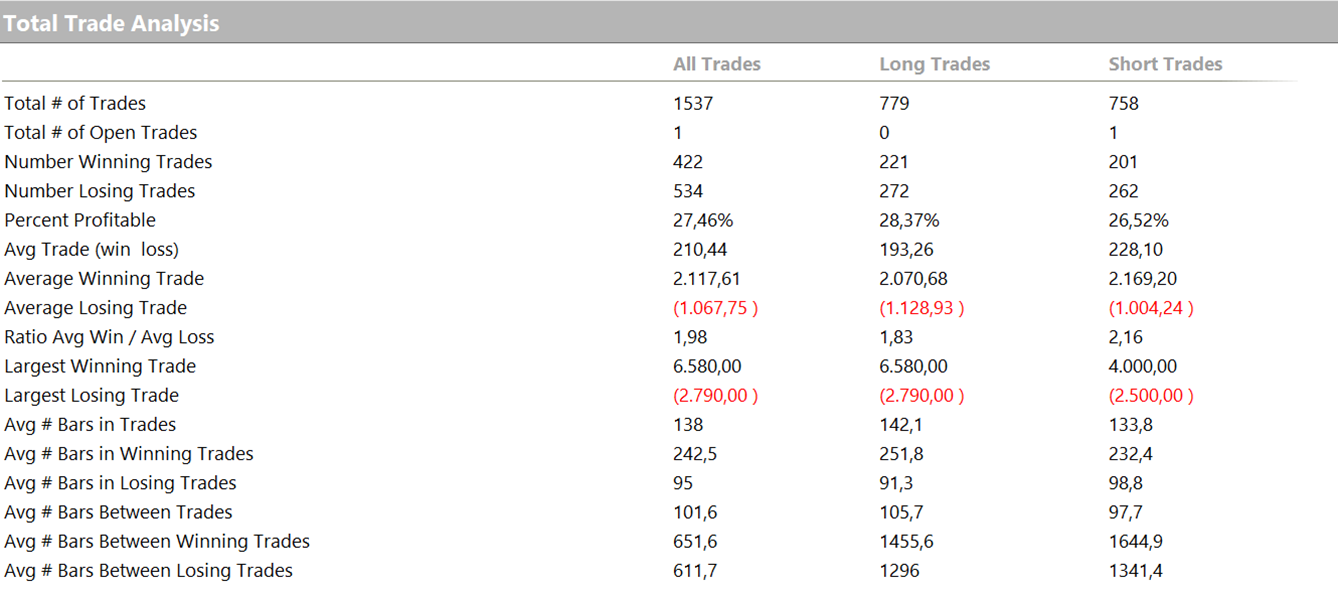
Figure 3 confirms two classic characteristics of trend-following systems:
-
- A low win rate (around 27.46%), which is expected for strategies that aim to catch larger moves while letting go of smaller, less meaningful ones;
- A strong average trade value ($210.44), supported by a win/loss ratio close to 2:1. In other words, a few high-quality trades more than make up for the smaller losses, exactly the dynamic you want in a trend-following approach.

Figure 3 – Total Trade Analysis of the Crude Oil Strategy (2010–2025).
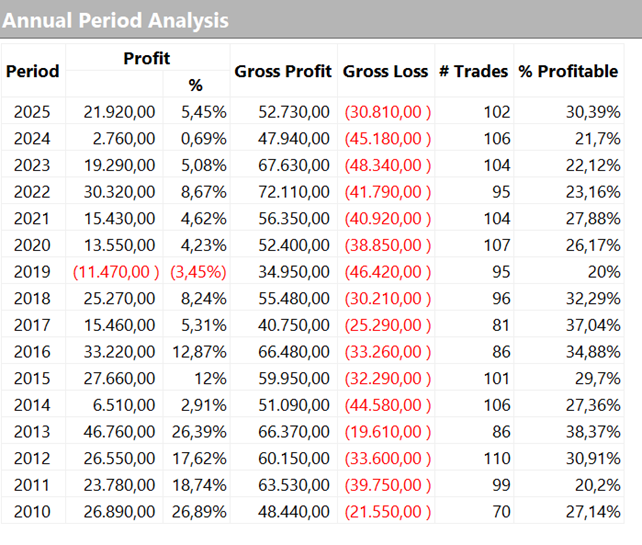
Lastly, Figure 4 provides an annual breakdown of performance, which is helpful for evaluating the strategy’s consistency over time. Out of all the years analyzed, only 2019 closed in the red (-$11,470), while every other year ended in profit. Notably, 2025 closed with a gain of +$21,920, proving that the strategy continued to deliver results even in the latest market conditions.
Strategy #2 – RB Gasoline: Trend Following with Breakouts of Key Levels
The second strategy is applied to RB Gasoline and takes a different approach from the first one, while still operating within a trend-following framework on a 15-minute intraday timeframe.
In this case, instead of moving averages, the strategy relies on key market levels, specifically, the highs and lows of the previous trading session.
The core idea is to trade in the direction of the breakout: when the price breaks above or below one of these levels, it’s assumed that the breakout may trigger a continuation of the trend.
Figure 5 shows a practical example: a short trade is initiated when the price breaks below the previous session’s low. The trade is then allowed to run until the profit target is reached.
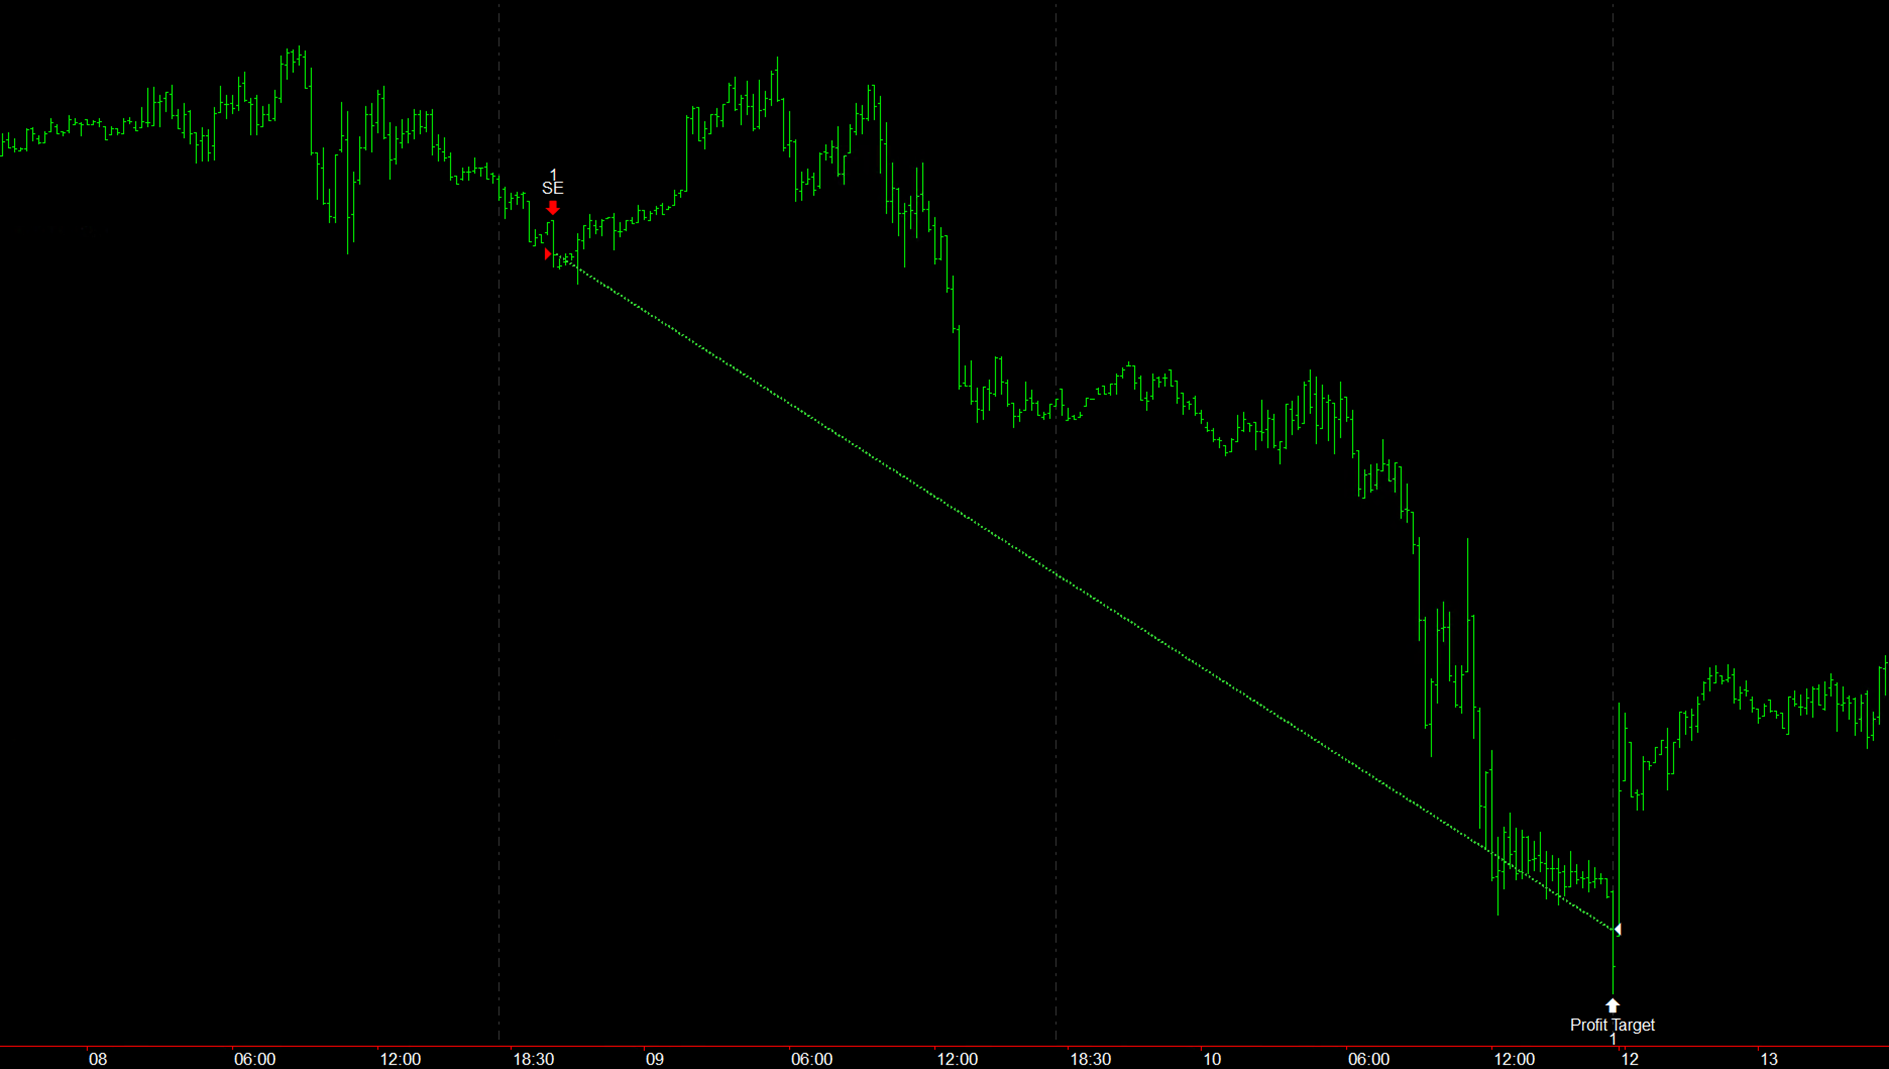
As with the previous strategy, trade management is handled through stop losses and profit targets, which are essential to limit losses during unfavorable market conditions and secure profits once the trend starts to lose momentum.
One critical aspect of trading RB Gasoline is liquidity. There are certain times of day when the market is thinner, and trading during these hours can lead to significant slippage in live trading. To address this, the strategy includes a time filter that restricts trade entries to periods when the market is sufficiently liquid. This not only improves the reliability of the backtest results, but also ensures greater alignment between simulated and live trading behavior.
RB Gasoline: Breakout Strategy Performance and Equity Curve on Intraday Timeframe
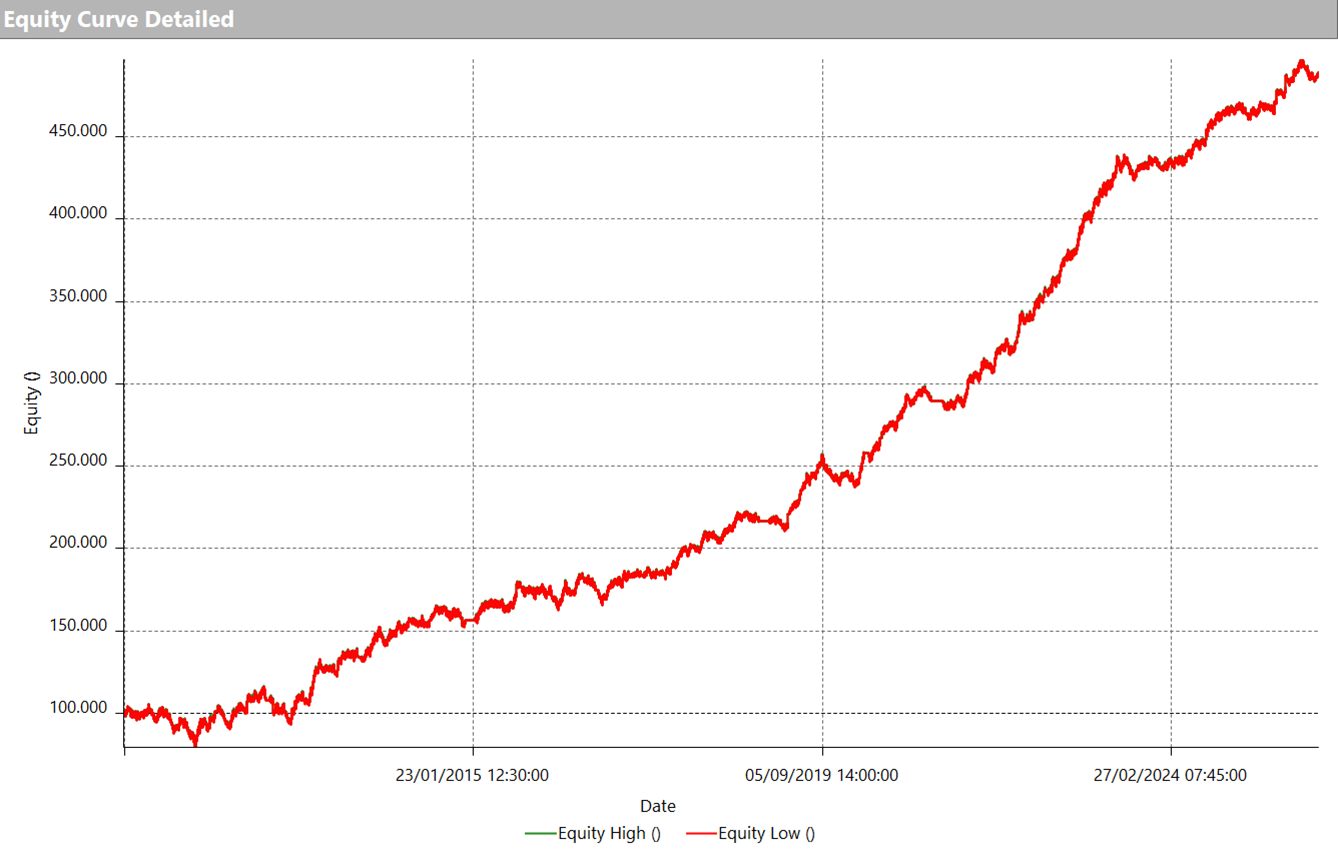
Here too, the equity line, shown in Figure 6, highlights a solid and relatively steady performance over the long term. While natural periods of consolidation appear, there are no prolonged drawdowns, indicating overall robustness.
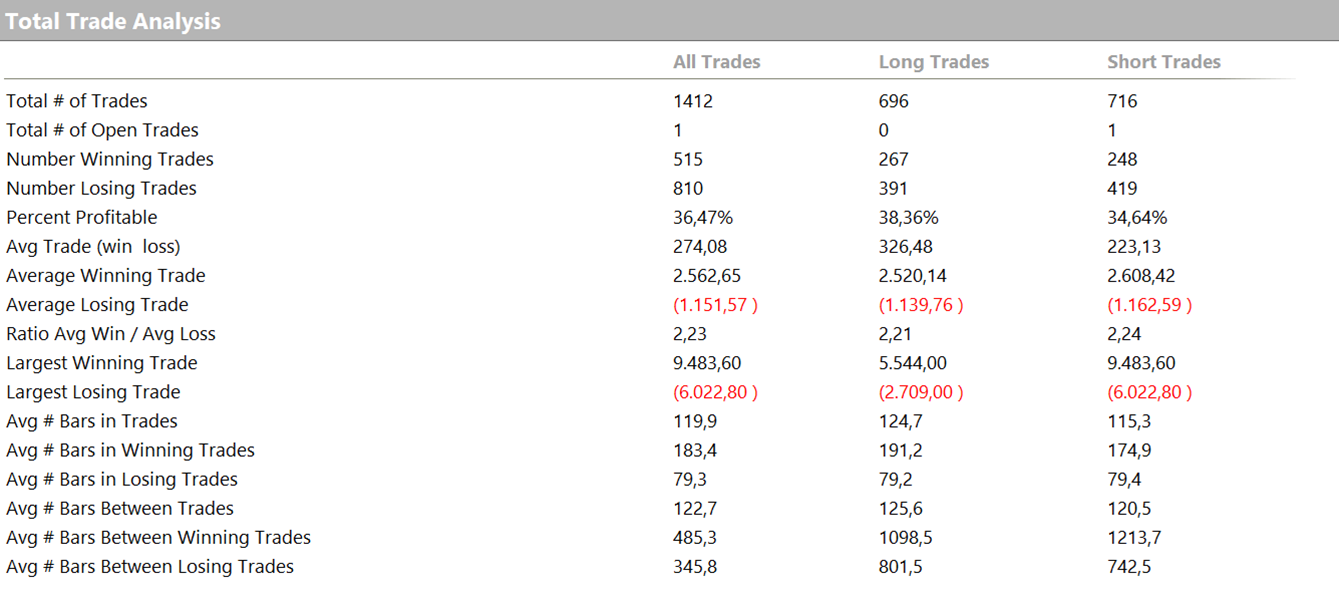
The statistics in Figure 7 further support the strength of the strategy. Compared to the Crude Oil system, this one has a higher win rate (36.47%) and an even more impressive average trade value of $274.08, signaling that the logic behind the breakout entries is efficient and well-calibrated.
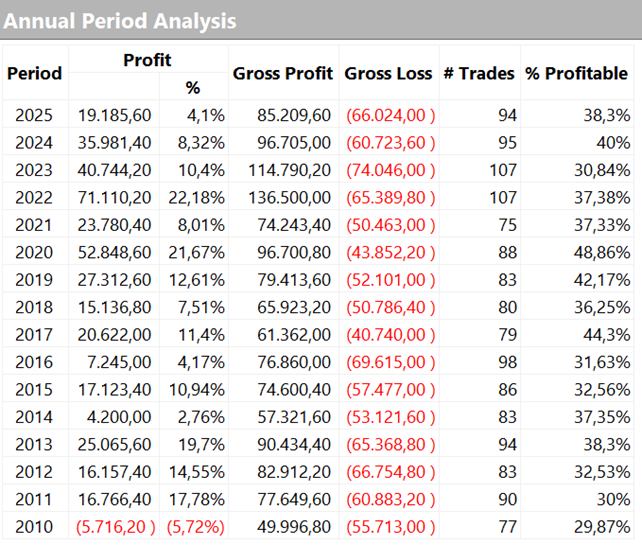
Finally, the annual performance analysis in Figure 8 completes the picture. Out of all the years analyzed, only 2010 closed negative, while every other year ended in profit.
Especially noteworthy is the result from 2025, which closed with a gain of +$19,185, demonstrating that the strategy continues to deliver solid results even in the most recent trading environment.
What These Strategies Teach Us About Trading Energy Futures
In recent years, many traders have likely stepped away from energy markets, discouraged by the lack of strong trends and the difficulty in identifying consistent movements in instruments like Crude Oil and RB Gasoline. It’s an understandable reaction but not the only viable one.
As we’ve seen, even simple, well-structured rules, like moving average crossovers or breakout strategies, can still work effectively, especially when supported by solid risk management and filters tailored to the market’s behavior.
The performance results prove that, even in a less favorable environment than in the past, these strategies have managed to generate meaningful returns.
Viewed through this lens, they shouldn’t be seen as stand-alone solutions, but rather as valuable components of a diversified trading portfolio, capable of capturing directional phases when they emerge.
So, even in challenging markets, there are still real opportunities for those who trade with discipline and realistic expectations.
Until next time… happy trading!


