
Welcome back to another edition of our portfolio strategy analysis. After exploring the commodity markets, today we shift our focus to two of the most prominent U.S. stocks: Amazon (AMZN) and Starbucks (SBUX).
This article has a twofold goal: on the one hand, to assess whether these two stocks offer appealing characteristics for systematic trading; and on the other, to compare two different trading approaches to determine which method is best suited to each stock’s unique behavior.
Amazon (AMZN) and Starbucks (SBUX): Two Stocks, Two Market Behaviors
Amazon is now synonymous with e-commerce, but over the years it has expanded into a broad range of sectors, including cloud computing (AWS), logistics, entertainment, and advertising.
It’s one of the most highly capitalized stocks in the world, known for its high volatility and strong directional trends over the long term.
Starbucks, by contrast, is the global leader in coffee and retail food & beverage. Its strength lies not only in its numbers but in the power of its brand and its ability to generate consistent cash flows through a highly replicable business model.
Unlike Amazon, Starbucks typically shows more restrained price movements, often influenced by macroeconomic factors tied to domestic consumption.
Two very different stocks with distinct behaviors. Let’s see if and how trading systems can adapt to each of them.
Trading System on Amazon (AMZN)
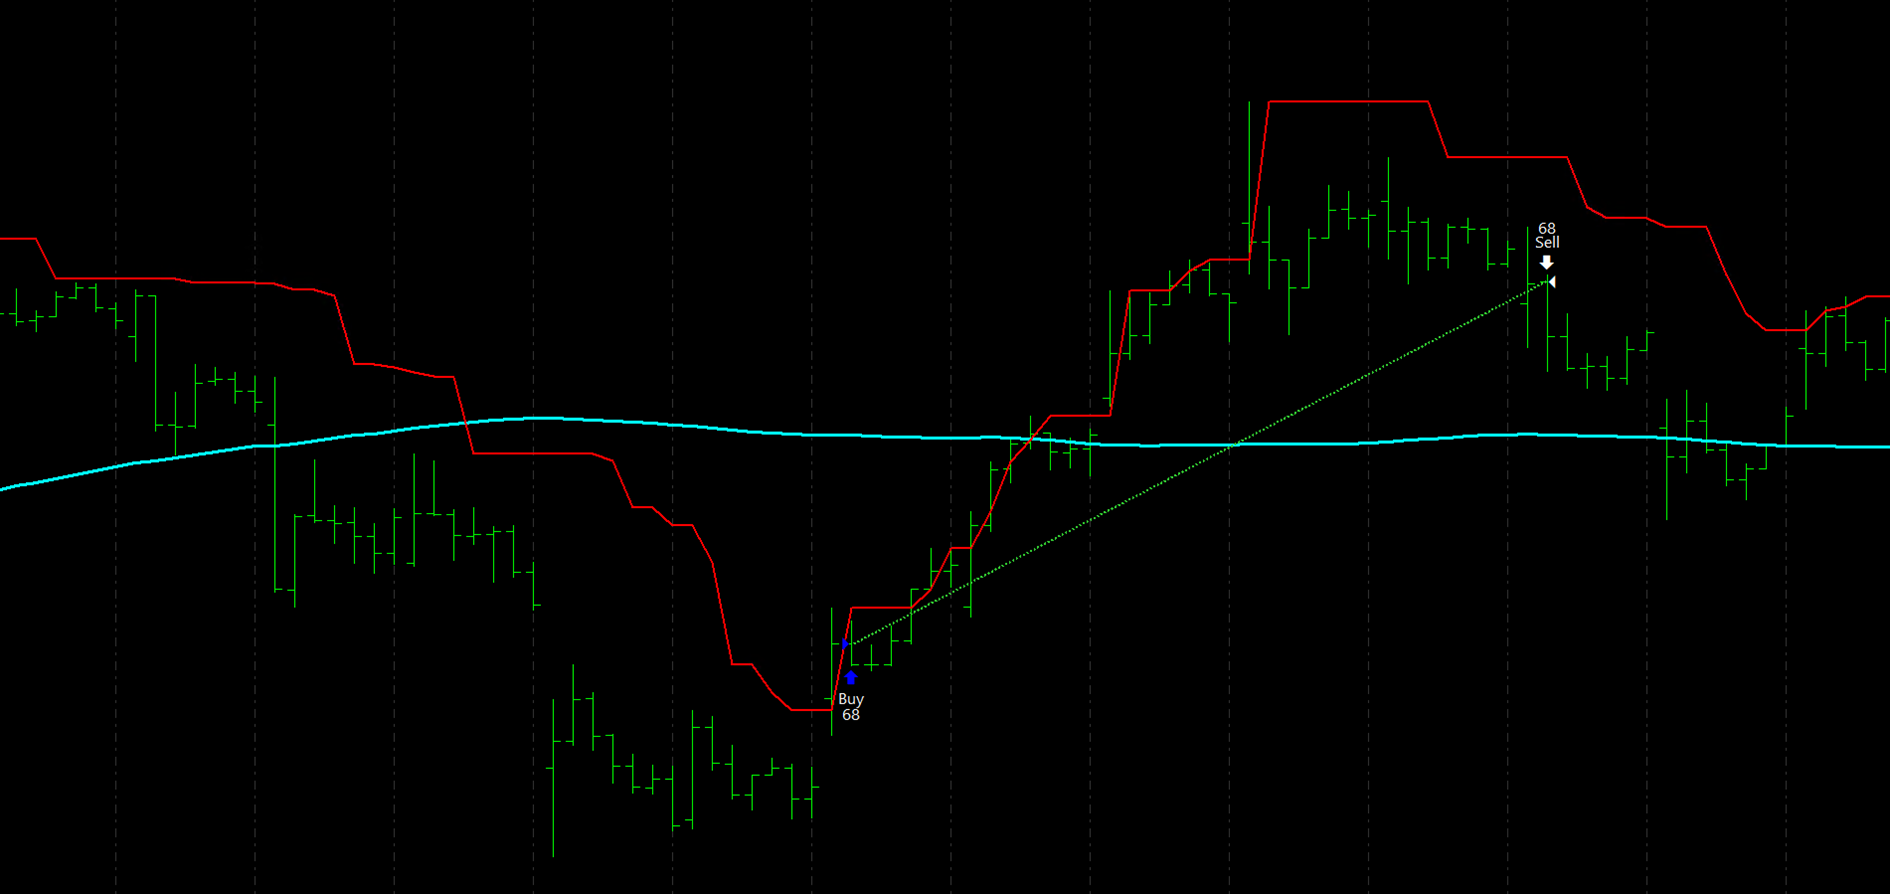
The first strategy we’ll examine was developed for Amazon stock and operates on an hourly (60-minute) time frame. The goal is to identify a potential bounce after an oversold phase, entering a long position only when the market shows enough strength to suggest a possible reversal.
Entry Setup:
- The price must be below the 100-period simple moving average, signaling an overall weak trend.
- The current candlestick’s close must break above the highest high of the last 9 bars, a potential breakout and sign of a short-term reversal.
When both conditions are met, the system enters a long trade at the next bar.
Figure 1 illustrates a clear example of this dynamic: we can see how the entry occurs after a brief rebound in an overall weak trend as indicated by the moving average.
Performance of the Amazon Trading System
The backtest was conducted using a fixed capital of $10,000 per trade to simulate a realistic and consistent trading approach over time.
As shown in Figure 2, the equity line reveals steady, consistent growth over the years, with no prolonged drawdown phases – an extremely favorable trait.
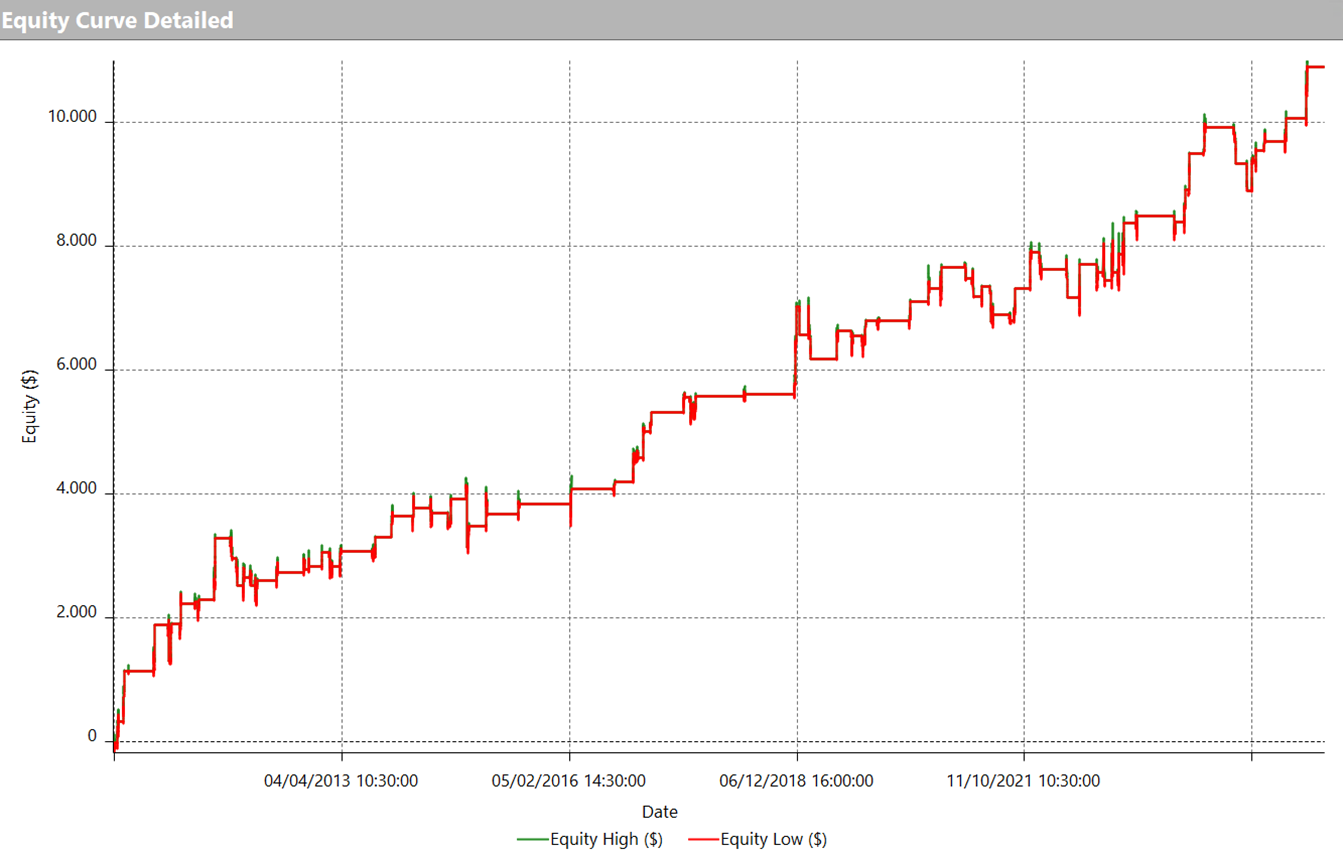
The total net profit is nearly $11,000, a very solid result considering the system executed only 89 trades over more than a decade. This confirms the strategy’s selective nature, which prioritizes quality entries over trade frequency.
From Figure 3, which summarizes the key performance metrics, we see a winning trade rate of 67.42% and an average trade profit of $122.27, which represents a 1.22% return per trade on the allocated capital.

Trading System on Starbucks (SBUX)
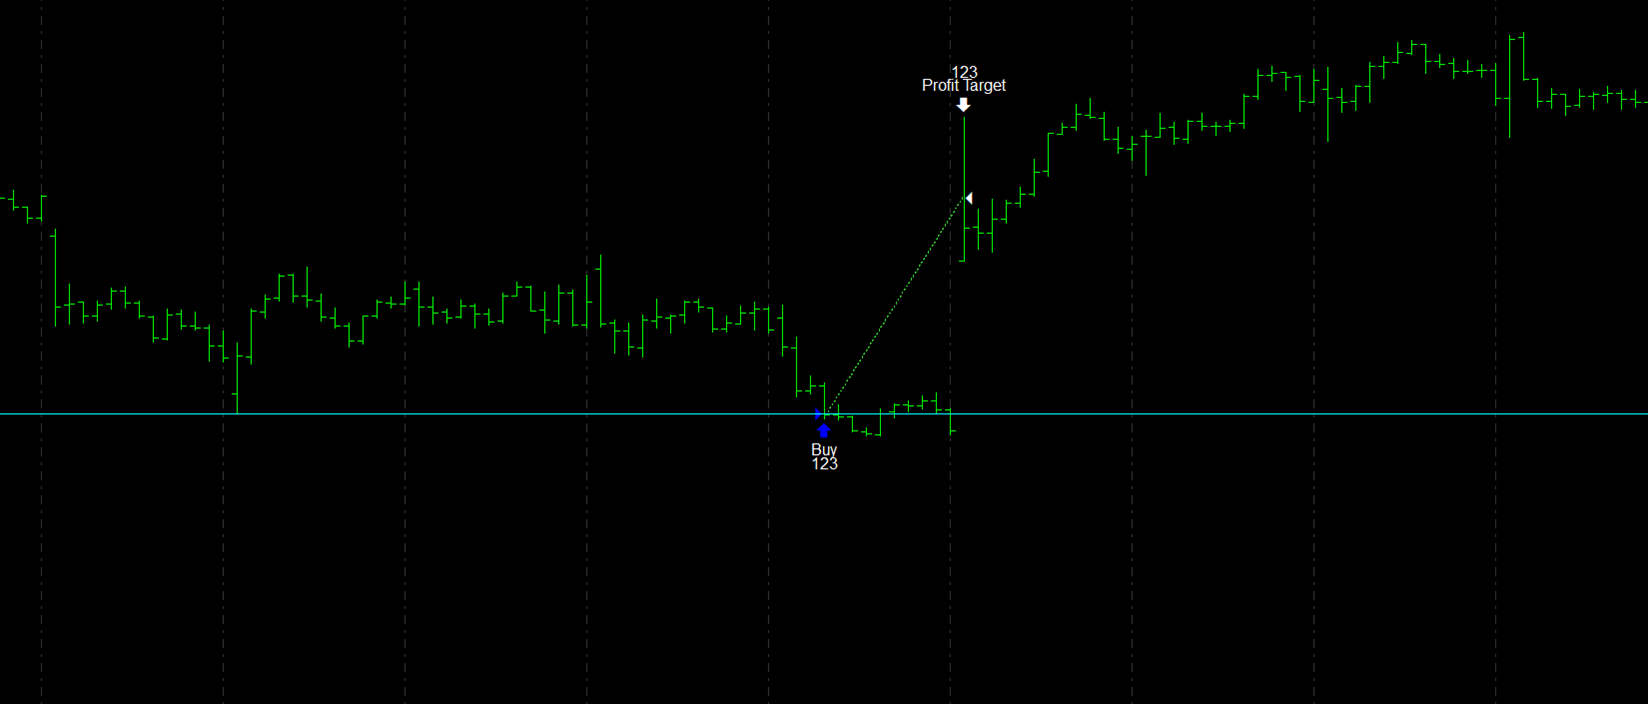
Now let’s move on to the second strategy, developed for Starbucks (SBUX). Unlike Amazon, this system is designed to exploit sharp downward pressure in the stock price and enter on a potential rebound. It’s a strategy built to intervene during strong sell-offs in anticipation of a recovery.
The entry logic is simple: a long position is opened when the price breaks below the lowest low of the last 4 sessions. Figure 4 shows a clear example of a trade.
Although the strategy logic was developed on a daily basis, the backtest was run on a lower time frame to enhance precision and reliability.
The trade is closed once a fixed profit target is hit, as shown in the example provided.
Performance of the Starbucks Trading System
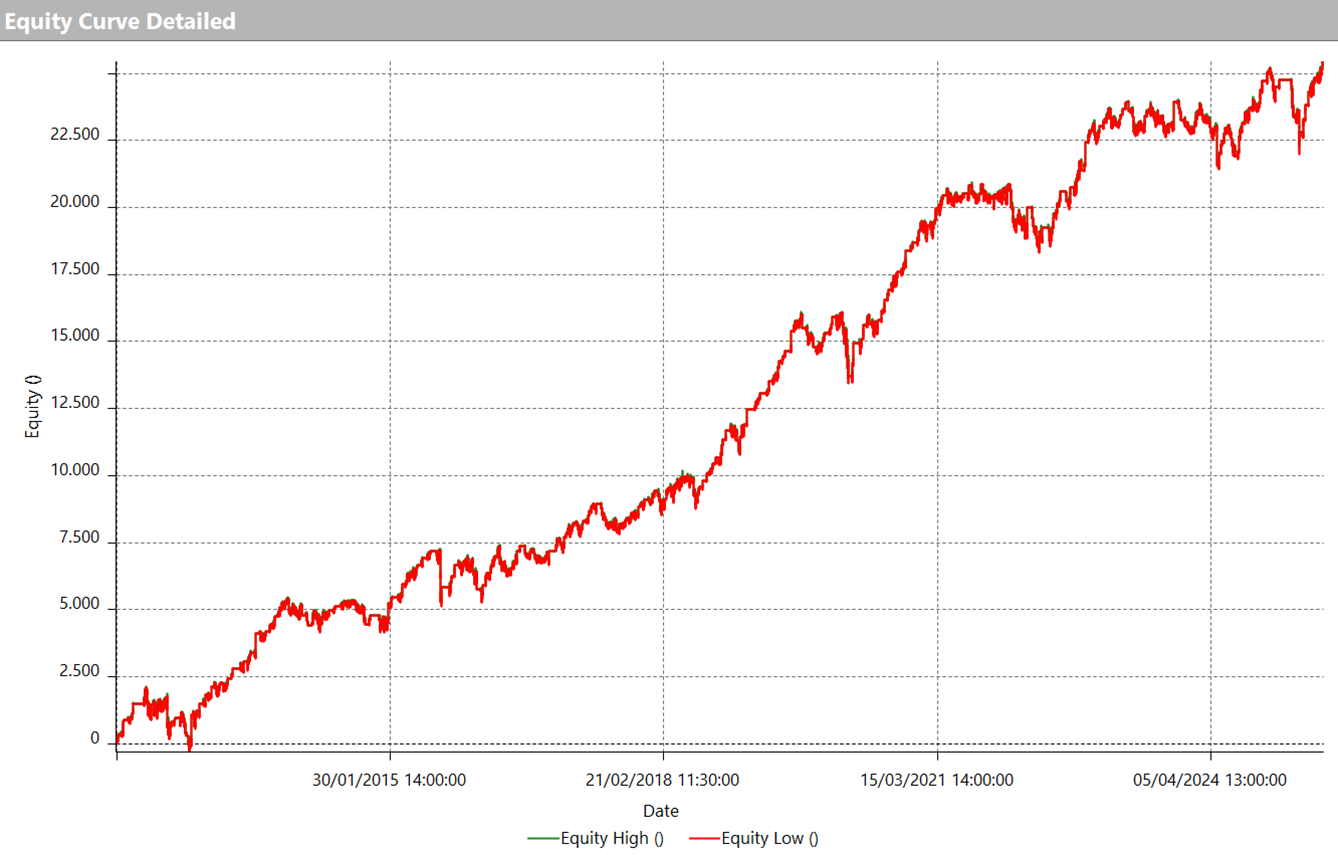
As shown in Figure 5, this system’s equity line displays a particularly strong and consistent uptrend, with even periods of marked acceleration. The total net profit exceeds $25,000, with a capital allocation of $10,000 per trade – figures that underscore the robustness of the approach.
A particularly noteworthy point is that the strategy just reached a new all-time equity high, even though Starbucks stock itself hasn’t yet returned to its own all-time highs. This suggests that the trading system is well adapted to less favorable market phases.
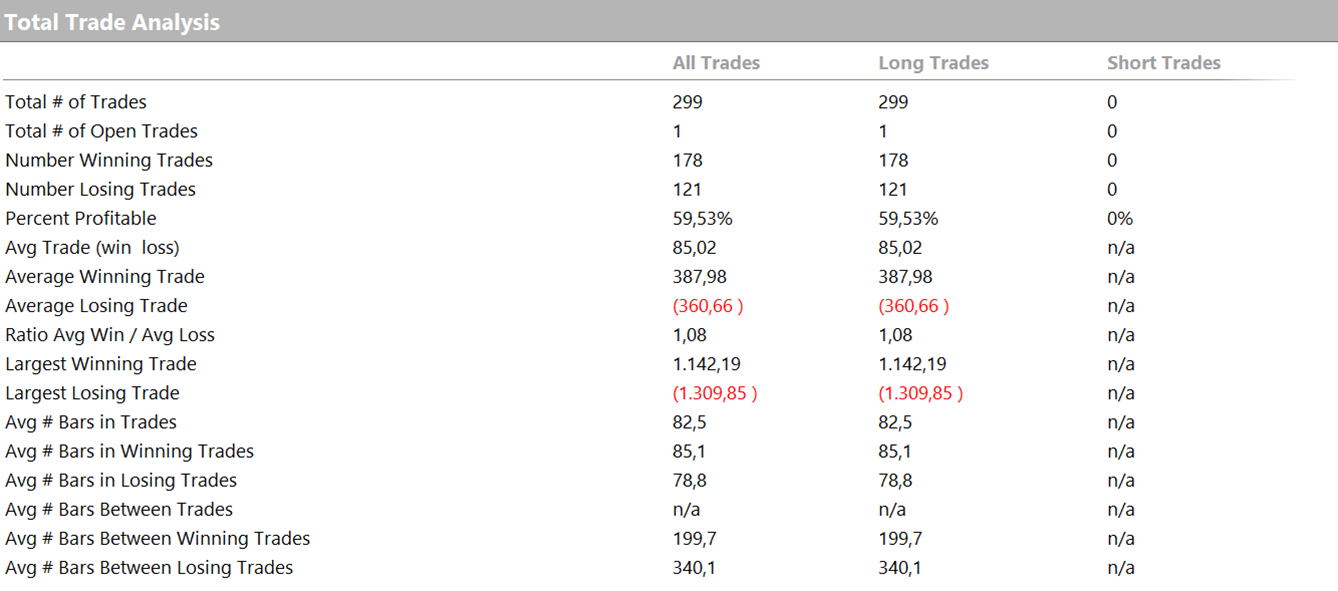
As seen in Figure 6, the system executed 299 trades, with a success rate of 59.53%. The average trade profit is $85, or 0.85% per trade based on capital used.
Final Thoughts: Why Trading Systems Also Work on Stocks
As we’ve seen, systematic logic can be effectively applied in the world of equities. The two strategies analyzed demonstrate that it’s possible to build simple yet powerful trading systems that adapt to varying market conditions.
What stands out most is their ability to generate consistent equity growth over time, even when the underlying stocks are underperforming or not near all-time highs.
This reaffirms that systematic trading isn’t limited to derivatives – it can be applied successfully to individual stocks like AMZN and SBUX as well.
Until next time!


