
The first strategy we’ll examine is a trend-following type based on a well-known concept in the world of systematic trading: using the Average True Range (ATR) to define dynamic entry thresholds.
The logic is simple: at the start of each trading day, the opening price is recorded. From this level, two thresholds are calculated – one upper and one lower – by adding and subtracting a multiple of the ATR.
The ATR is a volatility indicator that measures the average range of market movements over a specific period. In this case, it helps adapt the strategy to the current market context, making it more responsive during high-volatility periods and more selective when the market moves slowly.
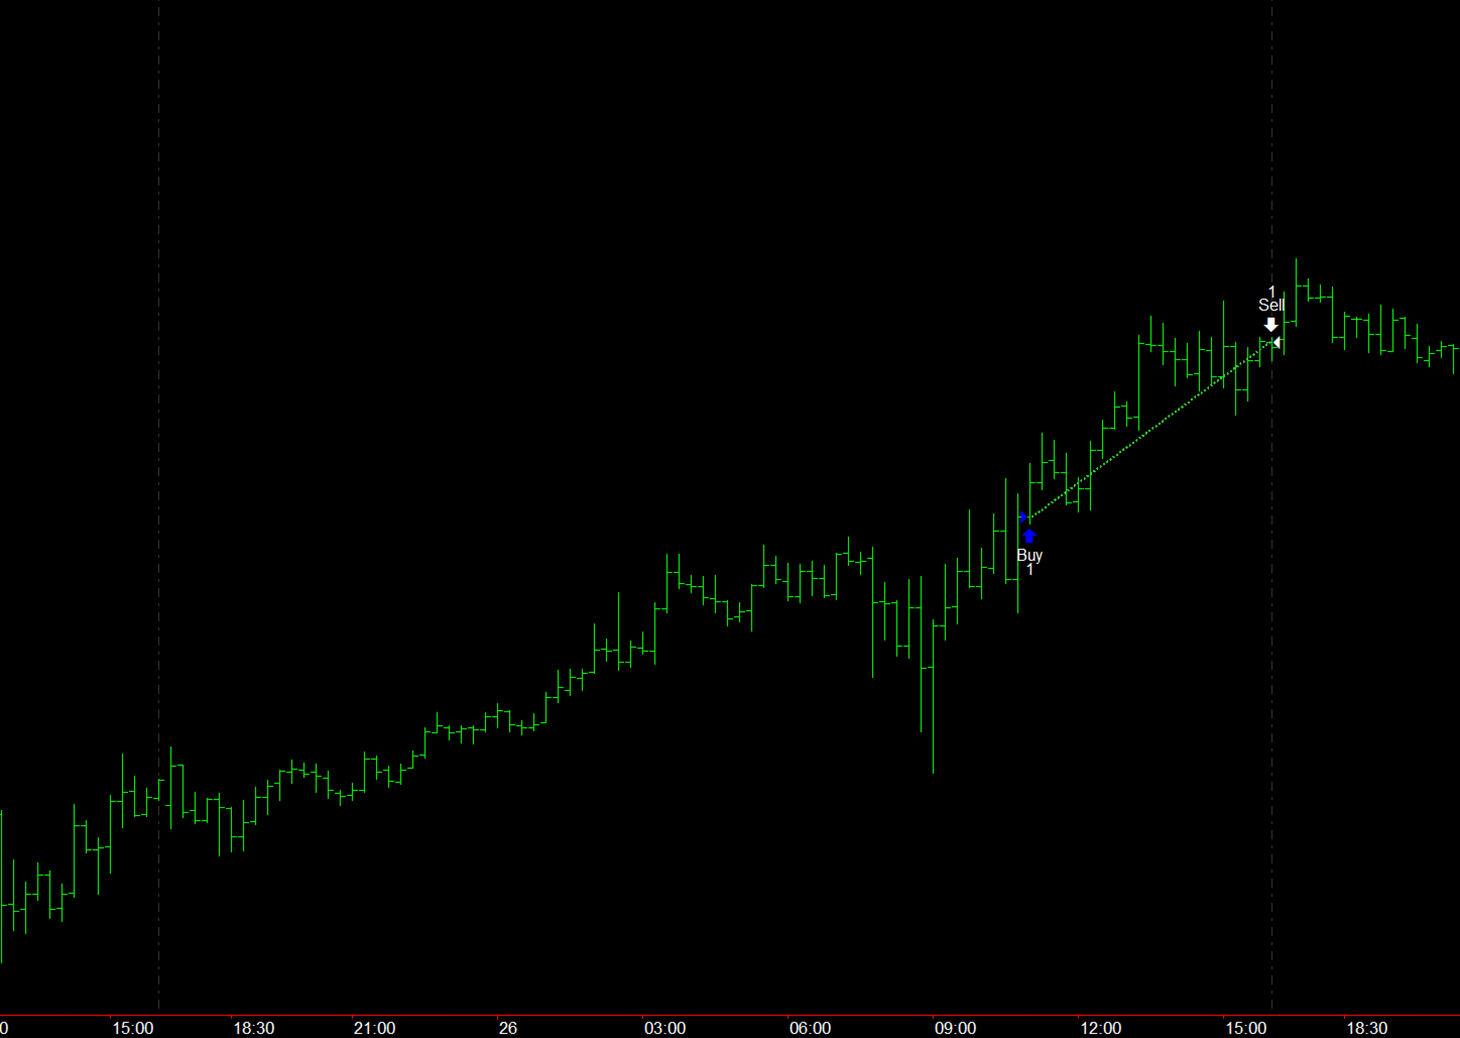
If a 15-minute bar closes above the upper level, the strategy opens a long position. Conversely, if it closes below the lower level, a short position is opened.
This is an intraday strategy, so unless there is an exit triggered by a stop loss or take profit, the position is closed at the end of the session.
Figure 1 shows an example of a long trade generated when the price exceeds the upper threshold.
ATR Strategy Performance on the Nasdaq 100 (2010–2025)
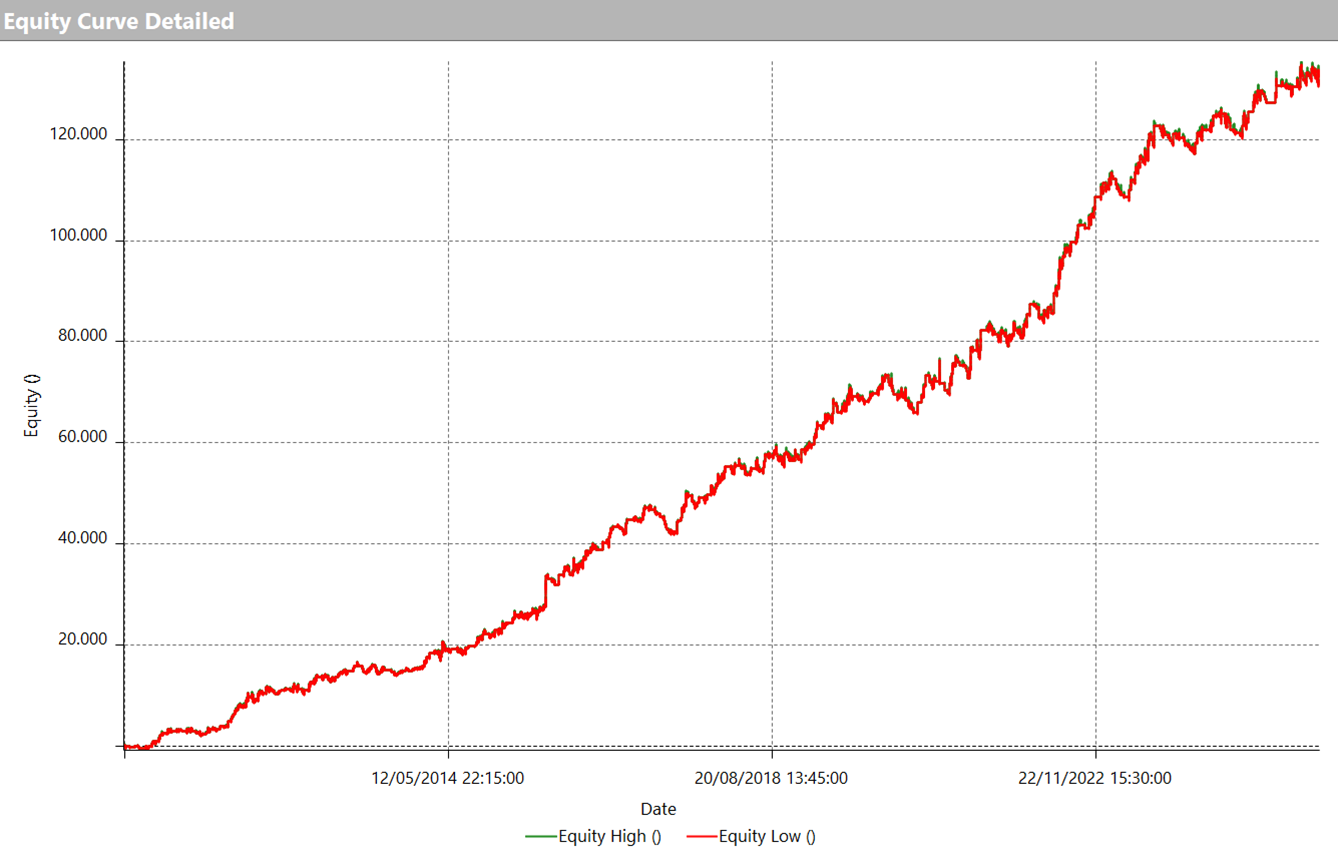
Analyzing the results of the strategy reveals an overall strong performance.
From 2010 to today, the profit curve (Figure 2) shows a steadily increasing and consistent equity line, with an almost linear progression over time and a particularly strong phase in the most recent period. This indicates that the system has been able to adapt to the new market conditions of 2025.
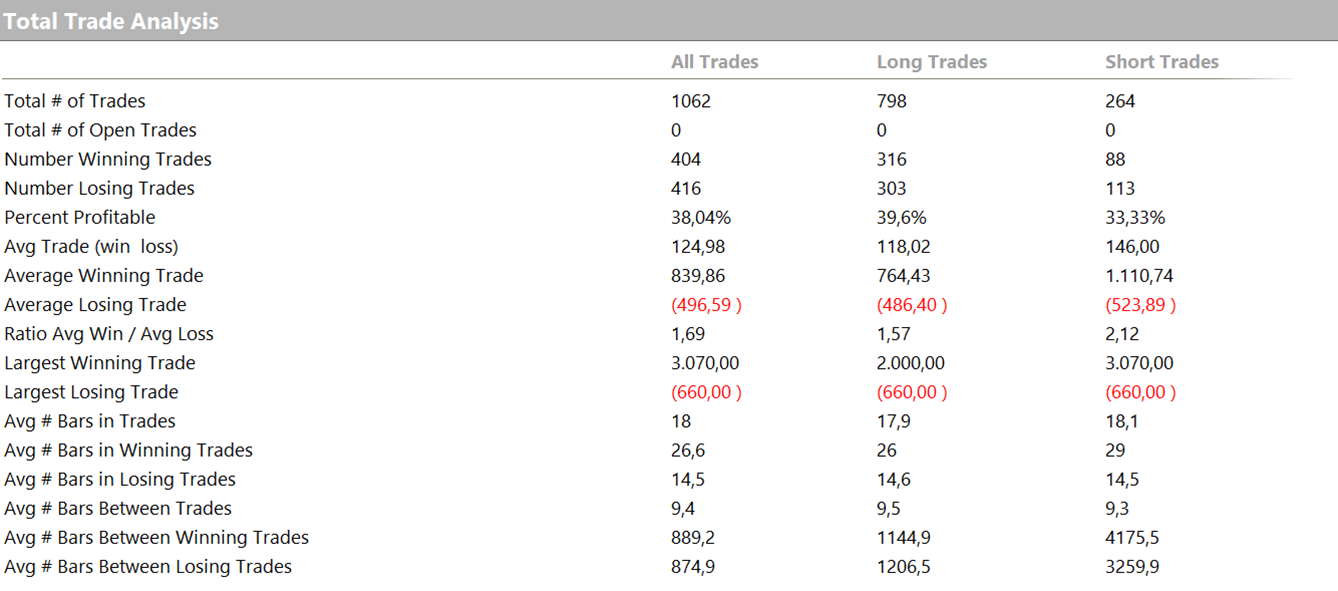
The strategy executed a total of 1,062 trades, as shown in Figure 3, with a win rate of 38% and an average trade value of approximately $124. While this figure isn’t particularly high, it aligns with the nature of intraday systems, which tend to generate numerous short-duration trades rather than a few large ones.
Strategy 2 – Long-Only Trend Following with Pullback on a 5-Minute Time Frame
The second strategy is also trend-following, but it includes a small “trick” that makes it more selective in its entries. In this case, it operates on a 5-minute time frame and opens only long positions.
Here’s the logic: when the high of the current bar is higher than the high of a certain number of previous bars, an uptrend condition is identified. However, the strategy doesn’t enter the market immediately; instead, it prefers to wait for a moment of temporary weakness.
Entry only occurs if the following bar closes lower; in other words, it shows a slight retracement relative to the main trend.
The core idea is to enter on a pullback, that is, on a brief move against the dominant trend. In other words, instead of chasing the price during strong moves, the strategy waits for the market to “take a breath” and then enters at a potentially more favorable price, still following the main trend direction.
This is also an intraday strategy, meaning all positions are closed by the end of the session at the latest.
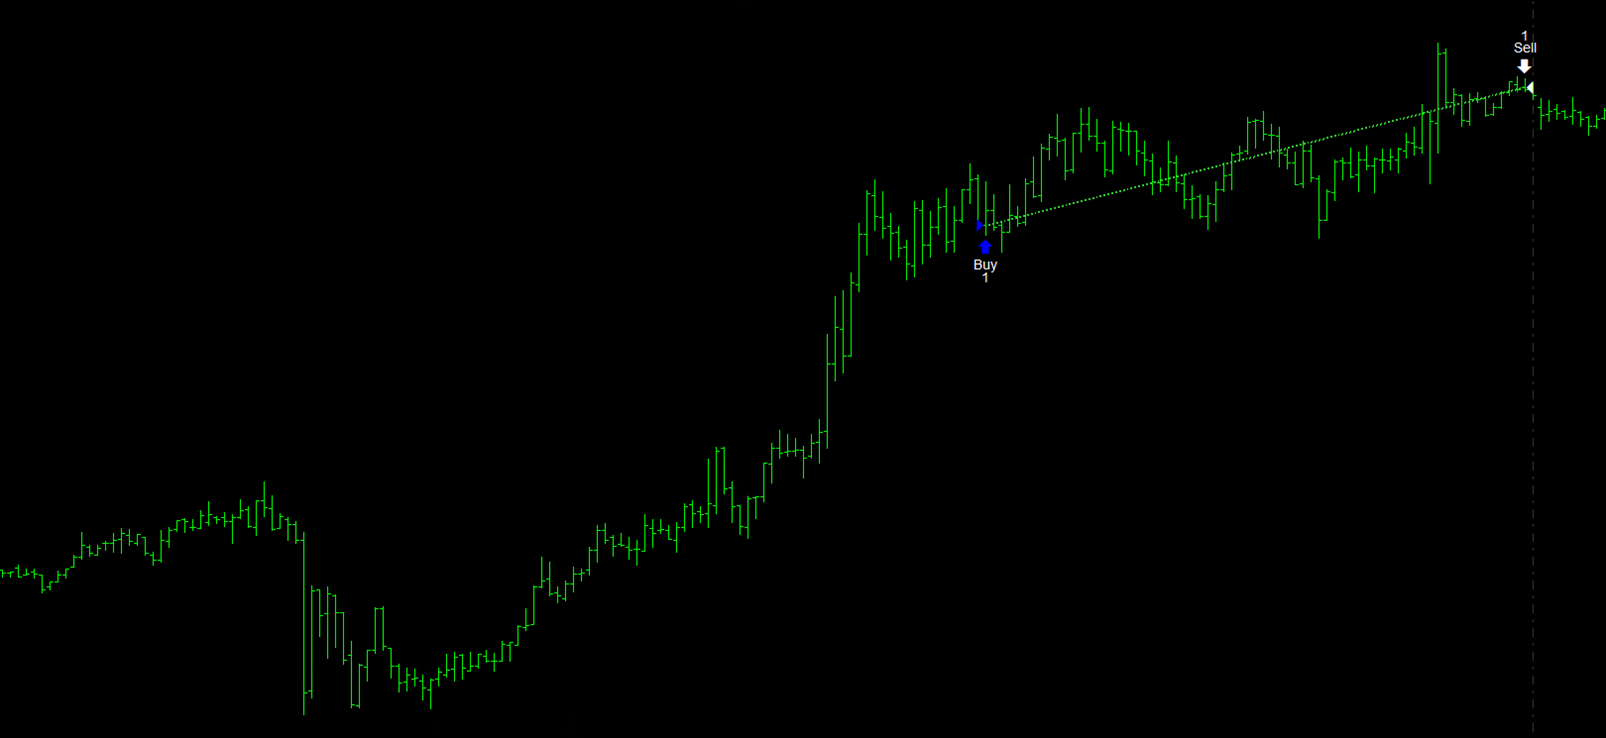
Figure 4 shows an example of a long trade opened after a pullback within an ongoing uptrend.
Performance of the Pullback Strategy
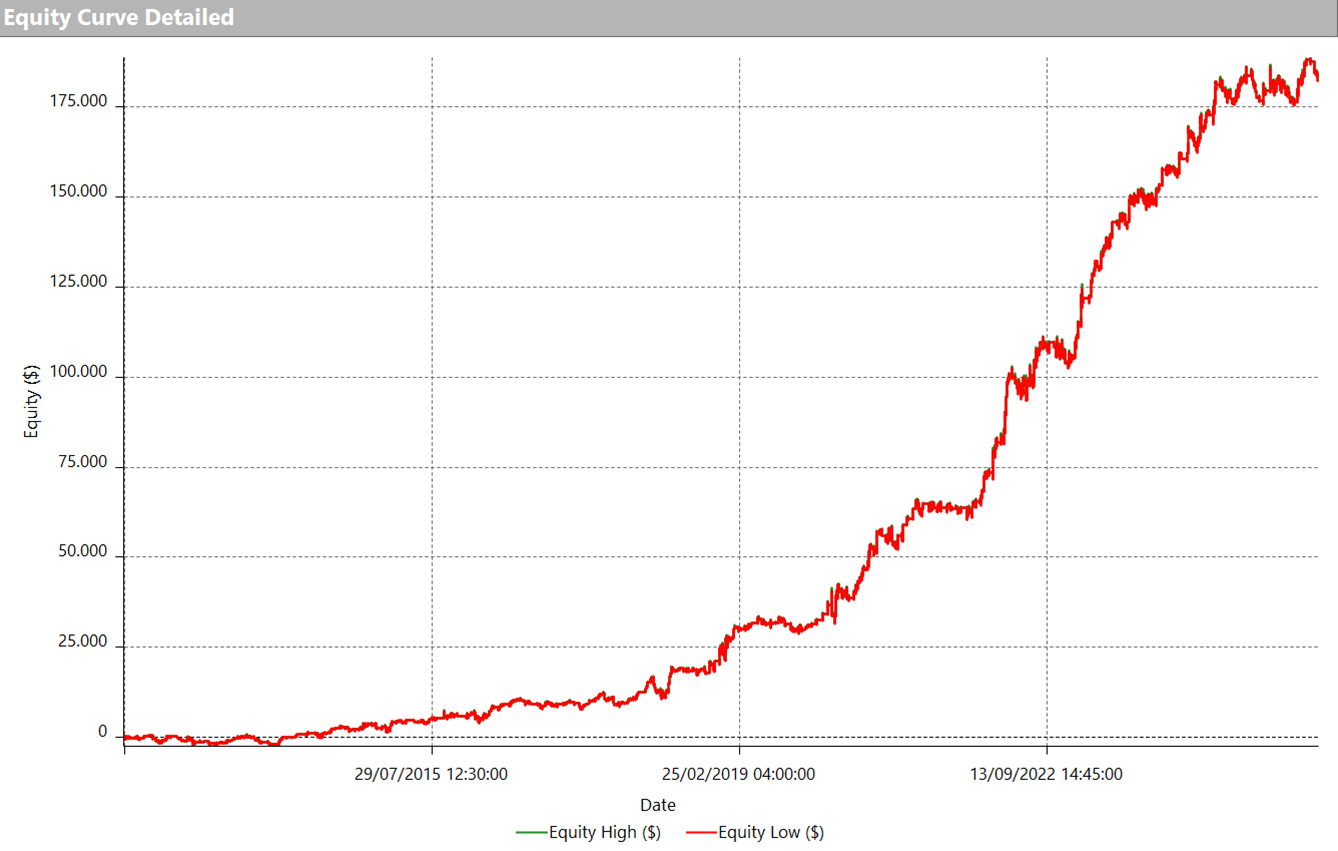
The strategy demonstrates a steady equity line growth (Figure 5), which overall reflects a stable and profitable behavior over time. After a slower initial phase, the system picked up significant momentum starting in 2019 and has continued growing to the present levels.
Recently, it has faced some challenges, likely due to being a long-only strategy, which makes it more exposed to certain Nasdaq phases, but it has still reached new equity highs, confirming the model’s resilience even in a highly volatile market.
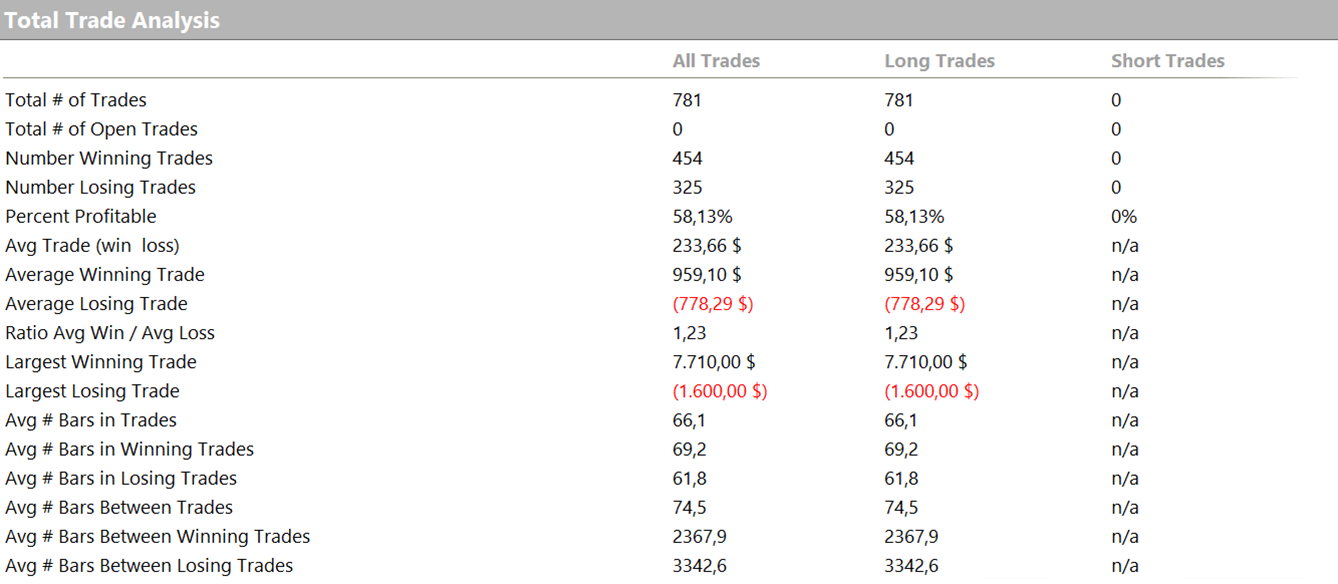
From a statistical standpoint, the strategy shows 781 trades, with a win rate of 58% and an average trade value of $233.
Overall, the performance appears solid and consistent, with the ability to bounce back positively even after short consolidation phases.
Trend Following on the Nasdaq During High Volatility
We’ve explored two development ideas that share a trend-following approach but rely on different logics: the first more direct, based on ATR-calculated levels, and the second more refined, waiting for a small pullback before entering the market.
The Nasdaq futures contract proves once again to be an excellent instrument for this type of work, thanks to its volatility and frequent directional moves, even during intraday sessions. Both strategies have shown promising results, maintaining a steady equity curve over time and behaving consistently with their underlying logic.
Now it’s your turn to evaluate how to adapt these ideas to your own approach, experimenting with parameters, filters, or different conditions to develop new operational variants.
Until next time!


