VIX Index: What Happened on August the 5th?
On the night between Sunday and Monday, we witnessed an escalation of events that impacted global markets in a very peculiar way.
I’m not just talking about the significant drop, particularly in the Japanese market, but more about the unusual spike in fear of an imminent recession.
I’m one of the coaches at Unger Academy, and today, I want to analyze with you what happened over the past few days.
We’ve mentioned fear, but how can we quantify it?
The simplest and most immediate way is to look at the VIX Index, which we see here on the screen.
What is the VIX Index?
The VIX Index, as a reminder, measures the implied volatility of 30-day options on the SPX, the Standard & Poor’s 500.
By analyzing the chart, we can immediately see that on Monday, August 5, the VIX reached levels around 65, something that hasn’t happened except during the Covid period in March 2020 and in 2008.
This level is crucial and inevitably causes consequences. Consequences that market participants have to face.
Three Categories of Traders, One Event
To summarize, we can distinguish three categories of people who experienced this firsthand.
The first category includes those who ignored what happened simply because they operate in markets uncorrelated with the stock index, such as trading systems on futures in soft commodities, grains, and meats.
Then there are those who made significant profits from this spike, using systematic or discretionary entries that take advantage of these sudden bullish trends.
And then there are those who found themselves with substantial losses, if not the entire capital lost.
If you recall, some time ago, I talked about the risk of selling options and how inevitably sudden events like the one that just happened, or for example, Covid, eventually occur.
In mathematical terms, these are probabilistically certain events.
Is It Possible to Predict These Events?
Now, can we predict these events with mathematical certainty? The answer is absolutely not.
But bear in mind, I am not yet distinguishing between systematic trading, like what we do at Unger Academy, or discretionary trading. We are simply talking about the ability to notice in advance when things start to go wrong.
How We Managed This Event
At Unger Academy, we test everything statistically and numerically. Among our proprietary indicators and signals, we have a very useful one for managing moments of intense market fear.
It is primarily based on the VIX Index, which we’ve already seen, and other aspects related to it, like the term structure of volatility and some of its characteristics.
This indicator sounded an alarm on Friday evening.
According to this indicator, we should have closed almost all bullish positions or non-bearish positions on Friday evening.
In fact, some members of our team did just that.
Now, I already hear someone objecting, saying: it’s easy to say now, but couldn’t you have told us on Friday evening? It’s easy to speak in hindsight.
Actually, I wanted to discuss another aspect related to the characteristic of these indicators used as operational filters.
This filter would have allowed us to avoid the recent volatility spike and other significant events like Covid, the 2018 crash, August 2015, 2008, and so on.
The Importance of Signals
However, this indicator also gives us other types of signals that are not always correct.
By this, I mean that stopping operations incurs costs because it costs to enter and exit positions, and it is impossible to predict an event with 100% certainty.
So there are many signals from this indicator that are not true, or better said, that don’t necessarily mean that an emergency will occur.
Therefore, exiting on warning signs costs and reduces returns compared to those who don’t use these filters.
So we are leaving a lot on the table, in addition to the various operational costs.
It’s clear that we leave returns on the table when things go well, but the flip side is that we are much safer and more confident about staying out of the market during negative events like the one that just occurred.
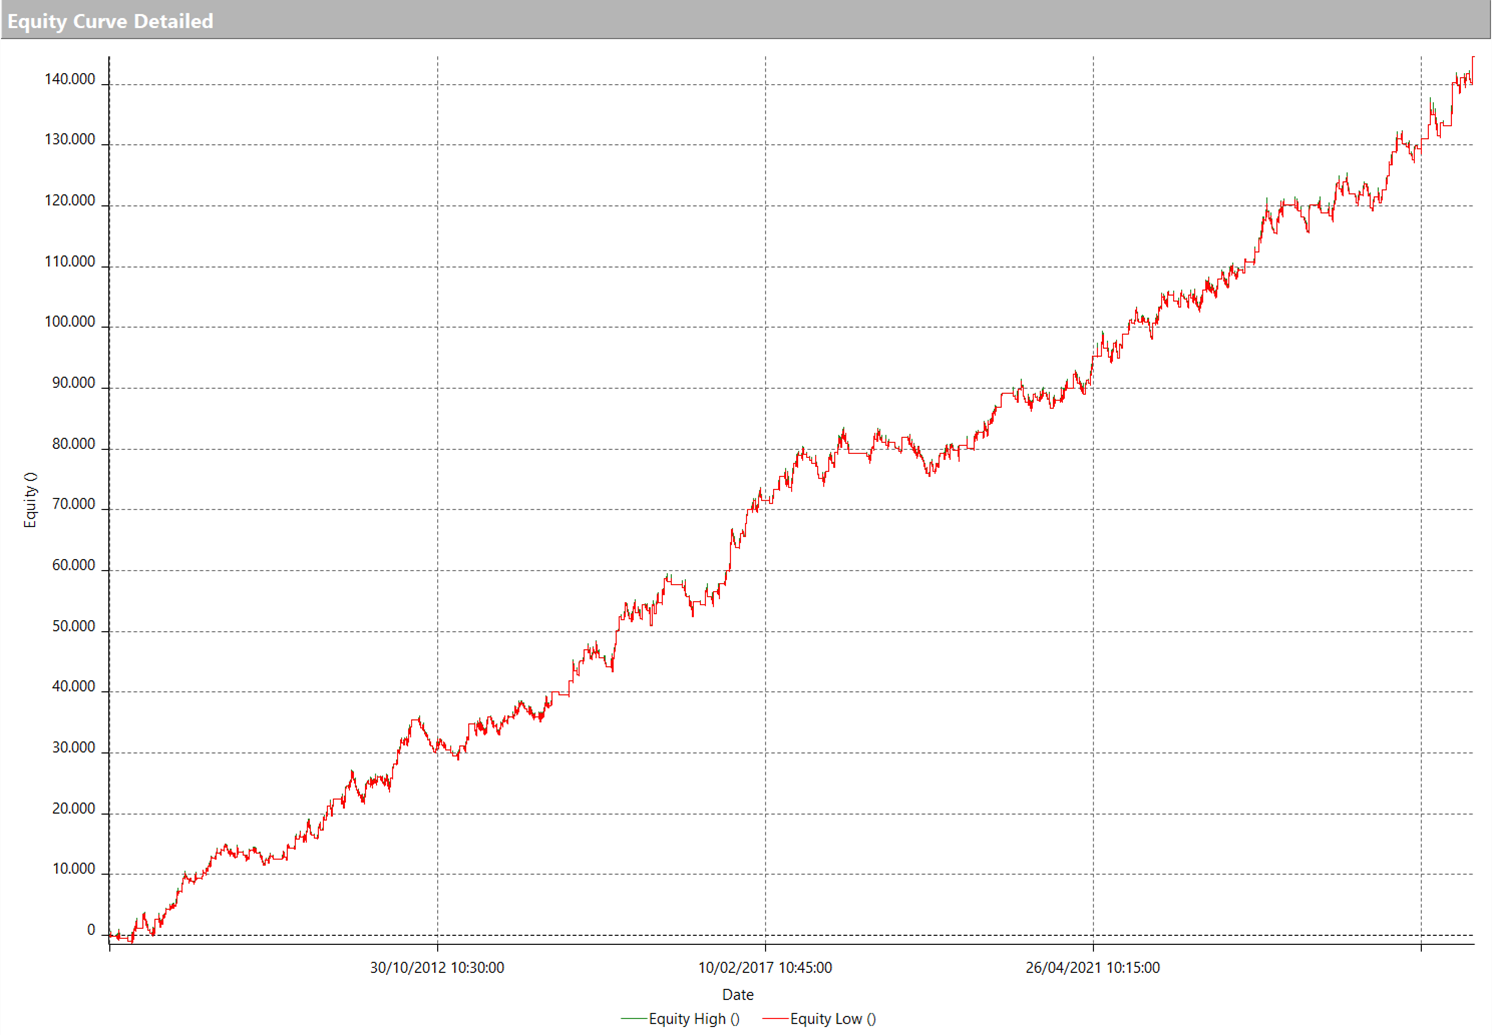
Let’s Look at the Chart
Now, to give you a sense of what happened on Monday the 5th, this was the equity line we showed on a naked put selling operation on the SPX index.
Here it is updated to today, zooming in from 2024. You see that returns from the beginning of 2024 were good, but in one session, we lost not only all the returns but our balance went well below zero.
Why We Should Always Listen To Numbers
In conclusion, I reiterate what was said a few weeks ago in the previous video: be aware of what you are doing, and be patient if we say it again and again, since we are systematic traders, but do always rely on numbers.
They are cold, unemotional, and remain our only lifeline in times of great fear.
Conclusion
If you are interested in systematic trading and want to explore these aspects from a numerical and statistical perspective, below in the first comment, you’ll find a link to numerous resources, including a free strategic consultation with one of our tutors.
Thank you very much for staying with me until the end of the video, and I look forward to seeing you in new videos with more operational insights. Bye everyone and happy trading.