In the world of trading systems, most traders tend to focus on the most popular instruments, such as the S&P 500 and Nasdaq. However, less crowded markets can often offer equally compelling opportunities.
In this article, we analyze an intraday trend following trading system applied to the E-mini S&P MidCap 400 futures (EMD), a less widely traded instrument that still offers significant potential. We will explore the market characteristics, the strategy rules, and the performance results over time.
EMD Futures: What They Are and Why They Matter in Systematic Trading
EMD is the futures contract that tracks the S&P MidCap 400 index, which includes U.S. mid-cap companies. This places it in a different segment compared to large-cap indices, which tend to receive more attention.
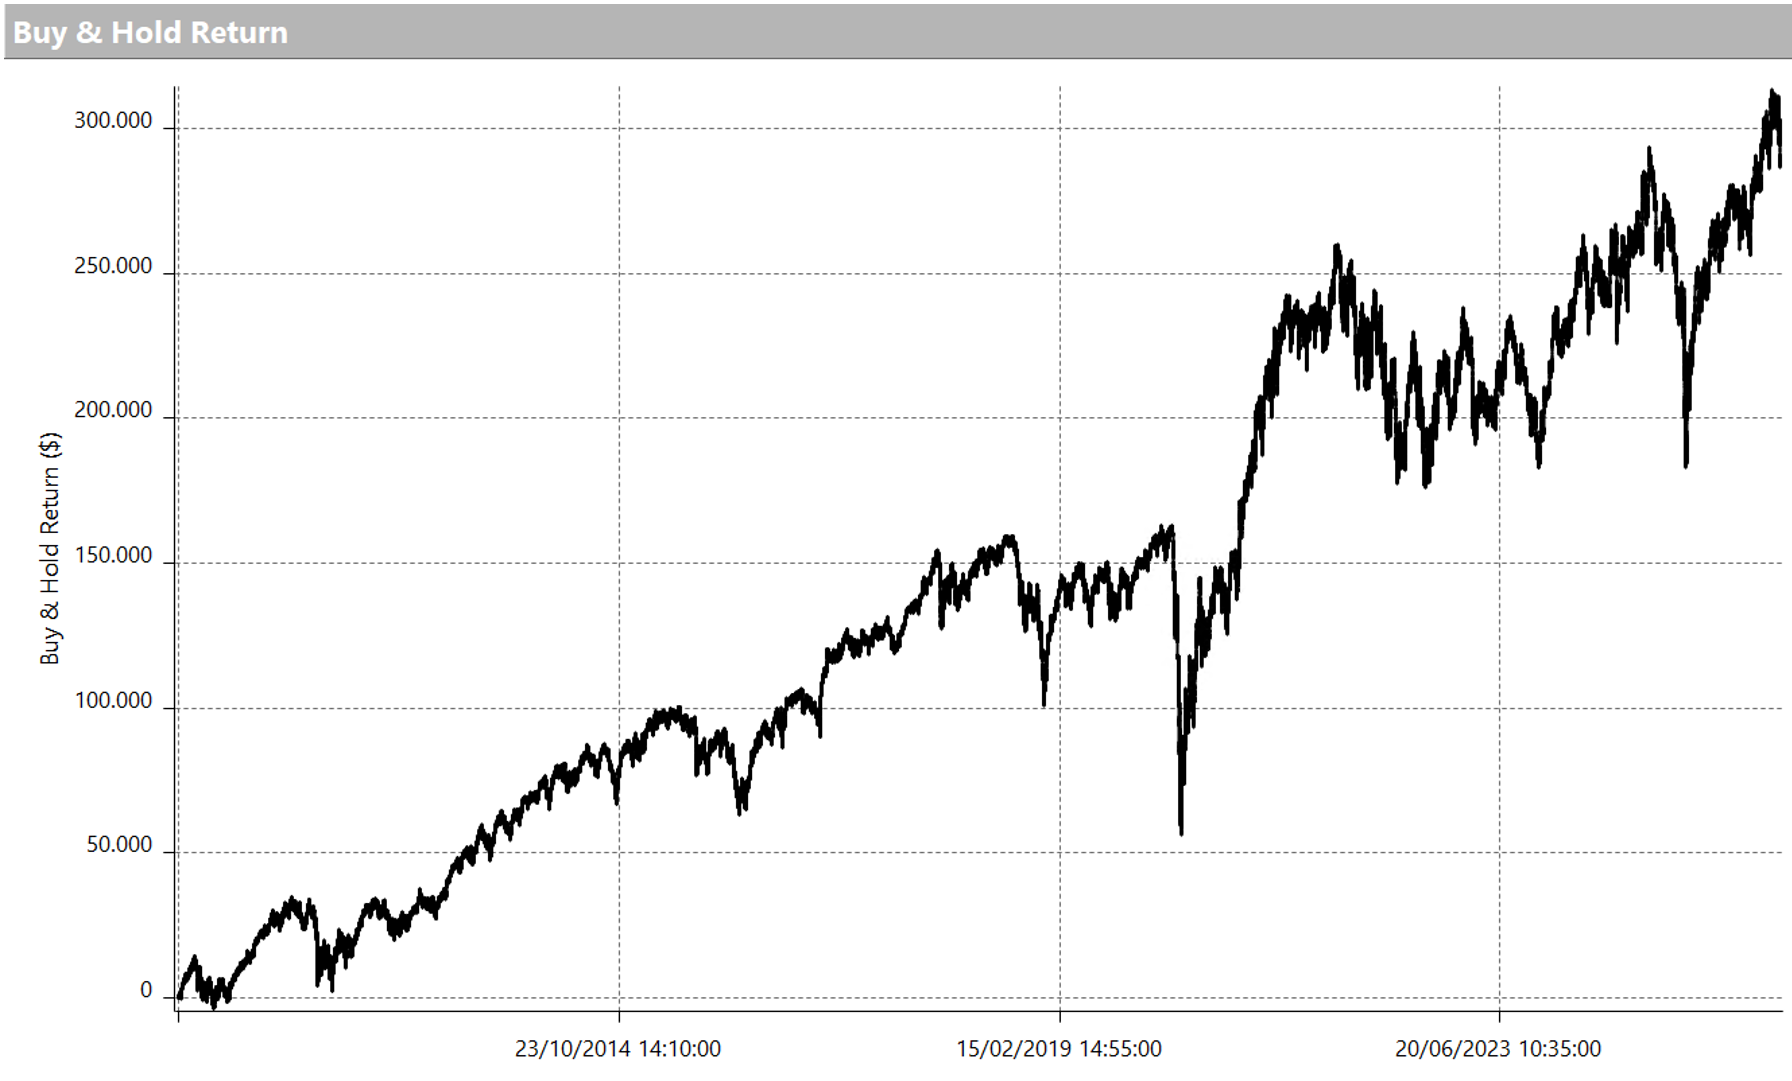
In Figure 1, we can observe the buy and hold performance of this futures contract. At first glance, it may appear less impressive than more popular benchmarks, which have delivered strong returns over the years. However, this is exactly what makes EMD interesting: less crowded markets can still provide valuable opportunities in systematic trading.
EMD Futures Volume and Liquidity: When the Market Becomes Most Active
As mentioned earlier, EMD is less traded compared to its more popular “counterparts” such as Nasdaq and the S&P 500, and this is reflected in its liquidity profile.
The contract trades in a session that runs from 5:00 PM to 4:00 PM Chicago time, following the nearly continuous structure typical of equity index futures.
Looking at a 5-minute chart in Figure 2, we can clearly identify periods of the day when trading activity is very low. The red histogram at the bottom represents volume, or the number of contracts traded in each bar. When the histogram is low, market activity is limited; when it increases, it indicates higher participation and stronger market activity.
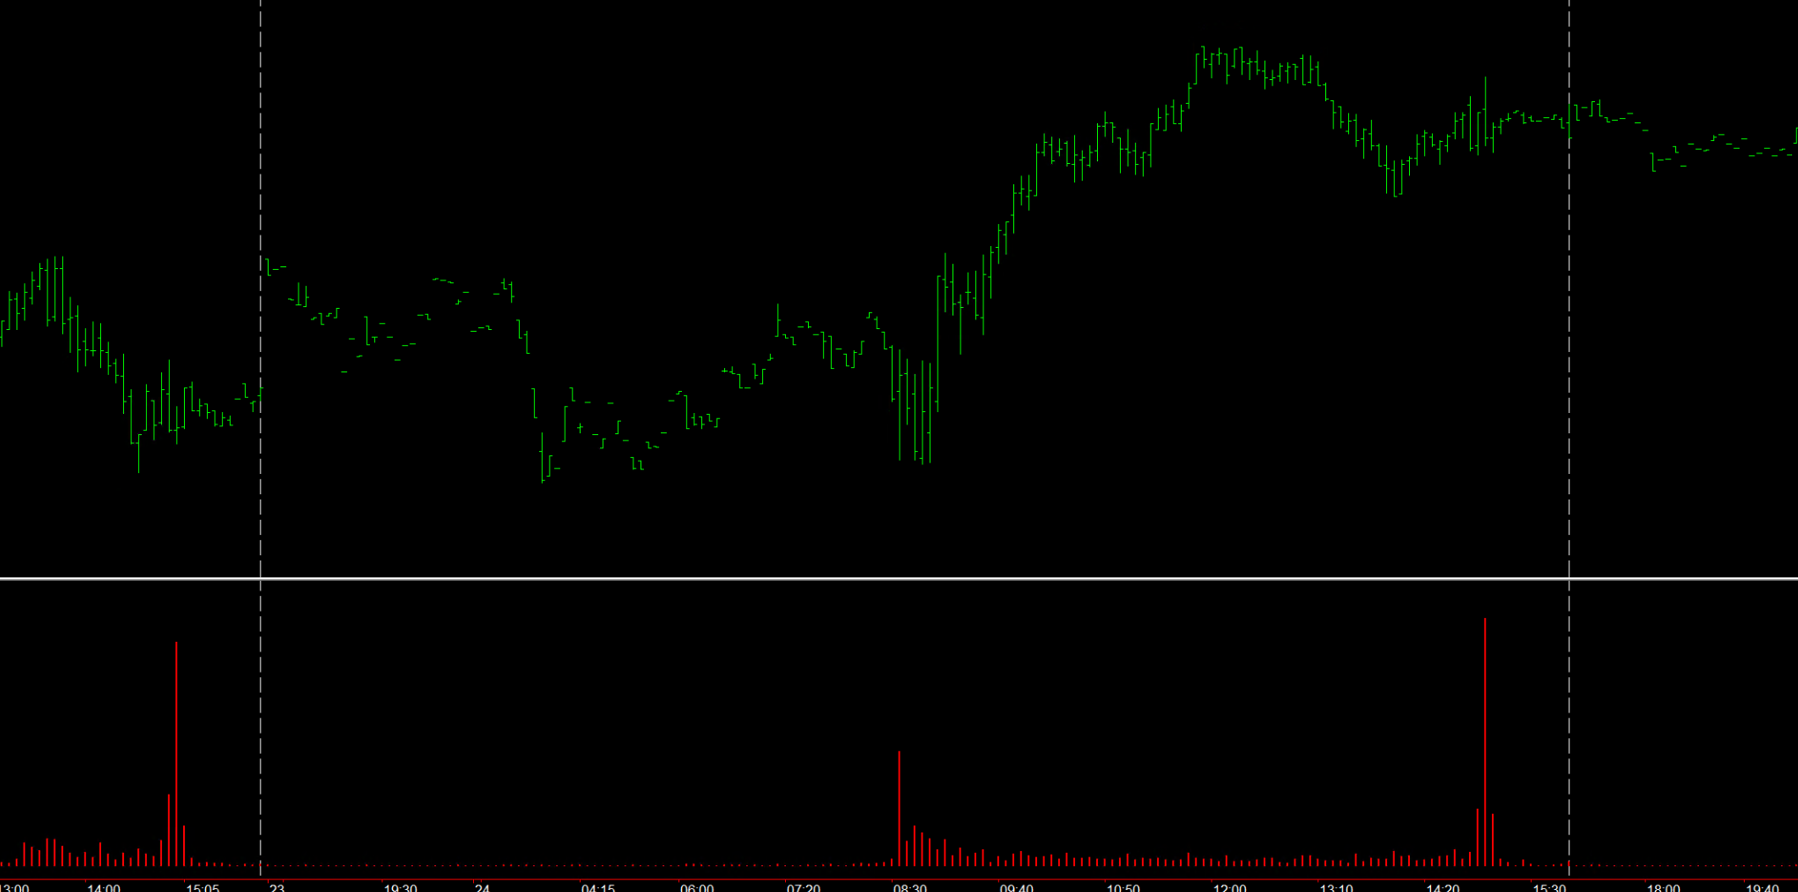
In the case of EMD, volume tends to increase significantly during the cash session, when the U.S. stock market is open for regular trading hours, from 8:30 AM to 3:00 PM Chicago time. This is when the futures contract becomes more active and more relevant for intraday analysis.
For this reason, it is crucial that trading systems, like the one we are about to analyze, focus on periods characterized by higher volume. Trading during these hours means operating in a more liquid, more readable environment, which is better suited for both development and live execution.
Intraday Trend Following Trading System: Logic and Entry Rules
The strategy analyzed is an intraday trend following system, therefore it operates by following ongoing trends (buying when prices rise and selling when they fall) and closes all positions by the end of the trading session.
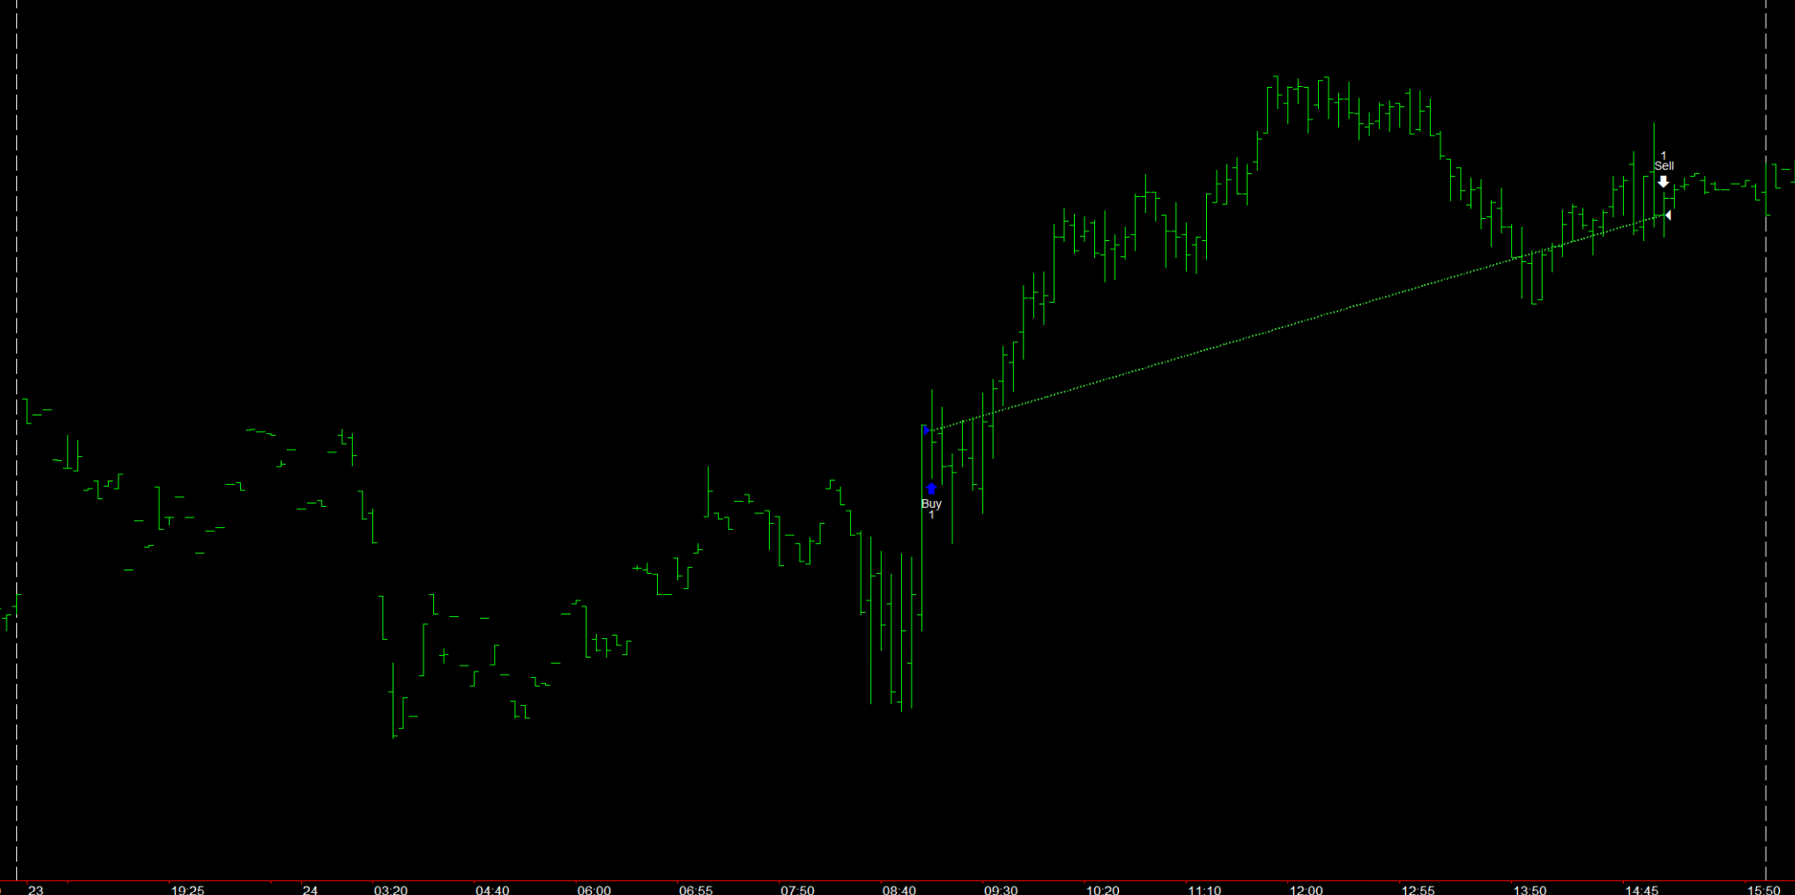
Let us now examine the strategy rules by referring to Figure 3. As can be seen from the image, we operate on a 5-minute timeframe and focus our activity exclusively on the early part of the cash session, specifically between 8:30 AM and 10:30 AM Chicago time.
The entry logic is fairly simple: the system enters long (that is, it buys) when a particularly large bullish bar appears, signaling above-average buying pressure, provided that certain confirmation conditions are also met. In a symmetrical way, the system enters short (that is, it sells) when a particularly large bearish bar forms, indicating significant selling pressure, again supported by additional filters.
As mentioned earlier, the objective is not to anticipate the move, but to enter only when the market is already showing a clear acceleration in a specific direction. In other words, the strategy aims to latch onto an already visible impulse, attempting to take advantage of its potential continuation throughout the session.
From a position management perspective, both a stop loss and a breakeven are applied, with the breakeven activating once a certain profit threshold is reached.
In any case, all positions are closed by 3:00 PM Chicago time, in order to avoid exposure during the final part of the trading day.
Strategy Performance: Equity Curve, Data, and Stability Over Time
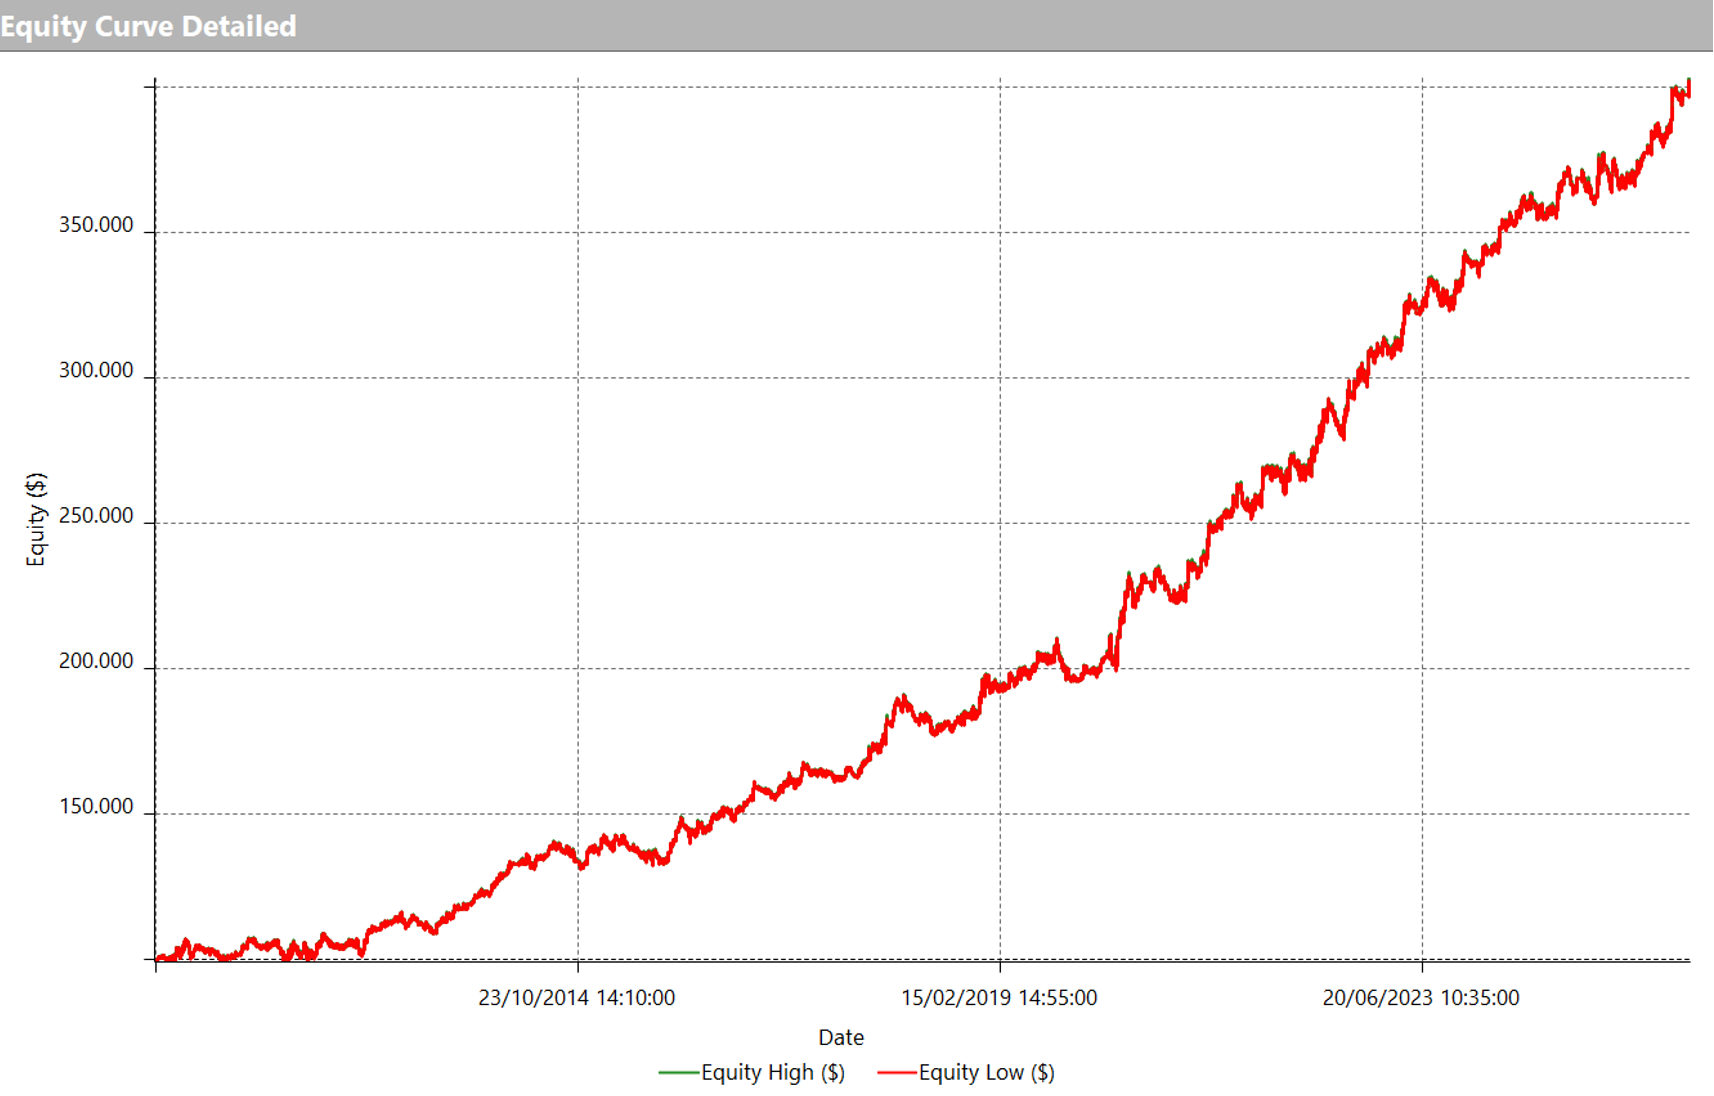
Turning now to performance, the results show a particularly interesting profile. In Figure 4, we can observe the equity curve of the strategy, which over the long term shows solid and fairly consistent growth. Although it is not without periods of slowdown, the curve maintains a well-structured shape, with an overall convincing progression across the entire historical period analyzed.
This is an important aspect, as it shows that the strategy is able to generate results in a fairly stable way, without relying exclusively on a few particularly favorable phases.
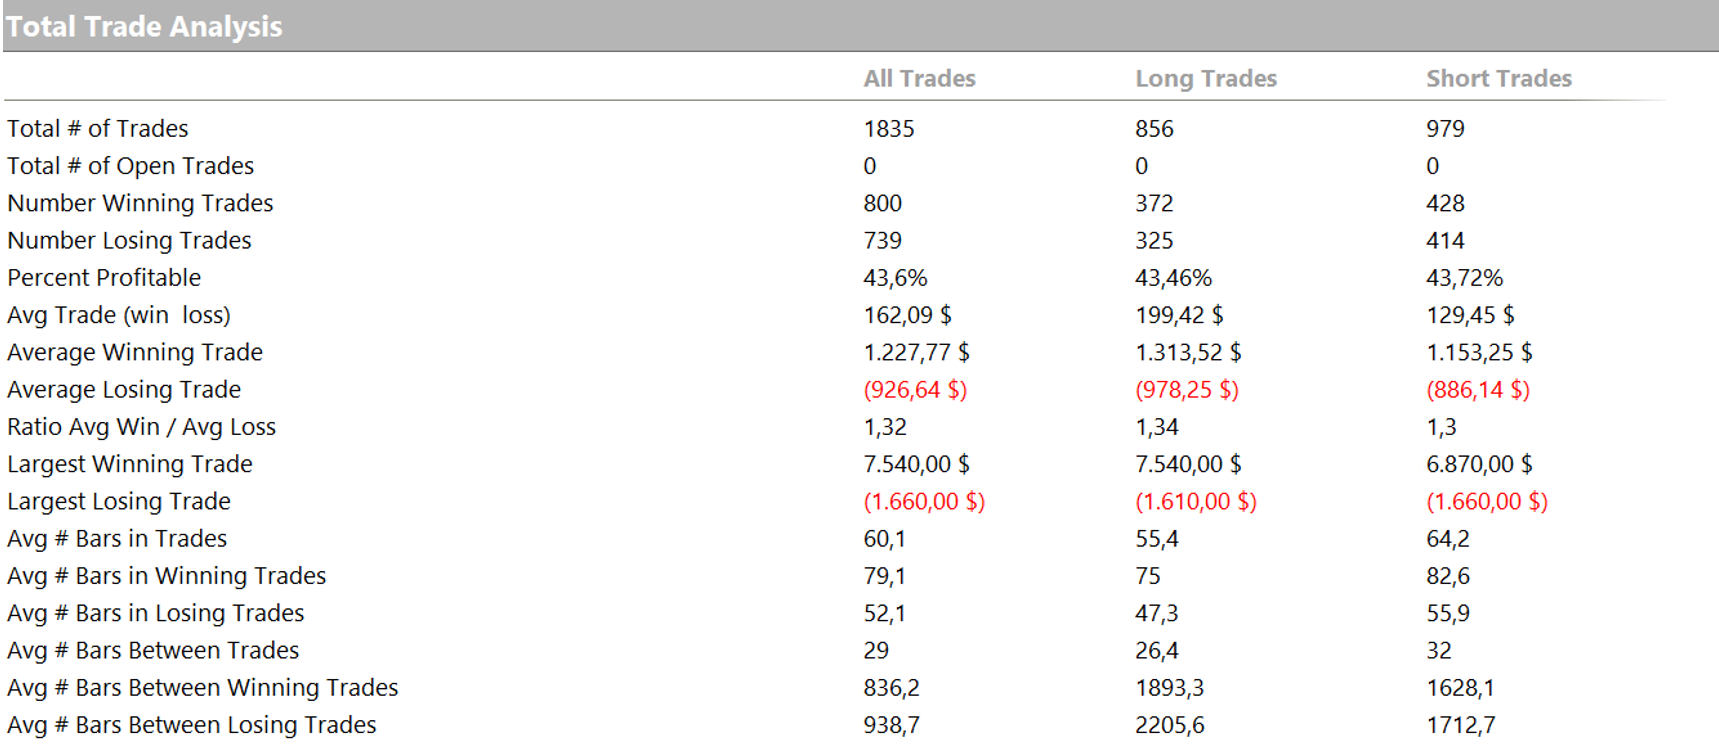
The data shown in Figure 5 is also particularly noteworthy. The strategy executes a total of 1,835 trades and shows an average trade of $162.09, a value that can be considered solid, especially in light of the intraday nature of the system. Since this type of logic keeps market exposure relatively short, being able to generate this level of average trade is undoubtedly a positive factor.
Overall, we are looking at a simple yet practical strategy, capable of delivering convincing performance even on a less widely followed instrument compared to more popular equity index futures.
Strategies on Less Crowded Markets: Why EMD Can Make a Difference in a Portfolio
In conclusion, this strategy once again shows how even less known or less frequently traded markets, compared to the major benchmarks, can offer very interesting opportunities from a systematic trading perspective.
Often, attention is focused on the same well-known instruments, but stepping outside this perimeter can make it possible to identify valid opportunities, sometimes with characteristics that are different and complementary to those of more popular markets.
For this reason, the final takeaway is to maintain an open and curious approach: exploring different instruments, analyzing their behavior, and testing their unique characteristics can be an excellent way to expand your portfolio of systems and discover ideas that, at first glance, might go unnoticed.
If you would like to explore this approach further, you can click the button below to speak directly with our team of experts: one of our tutors will answer your questions and explain how our scientific approach to the markets works.
See you soon and happy trading!