Hello everyone, I’m one of the coaches of Unger Academy and I’d like to welcome you to this brand new video.
Today we’re going to be talking about US stock indexes again and we get back to our discussion about trading the stocks that are in a sideways trend.
We’ve already made tests on four important indexes – Russell 1000, Dow Jones, Nasdaq, and S&P 500 – creating the ranking with a time horizon of one month. What we’ll try to do in this video is to reduce the observation time for creating the ranking to one week. In addition, we’ll also lower the frequency for the rebalancing of the portfolio, reducing it from one month to one week.
Now for this test, we’re going to use the templates we have already seen in the previous video. I’m using the same number of stocks as the last time, but I’ve changed the rebalancing so that it’s done every weekend. Then I set the observation period for the creation of the ranking to 5 days. This means that we no longer have a Composite Momentum or a Momentum on longer periods, but that we simply have a trading week.
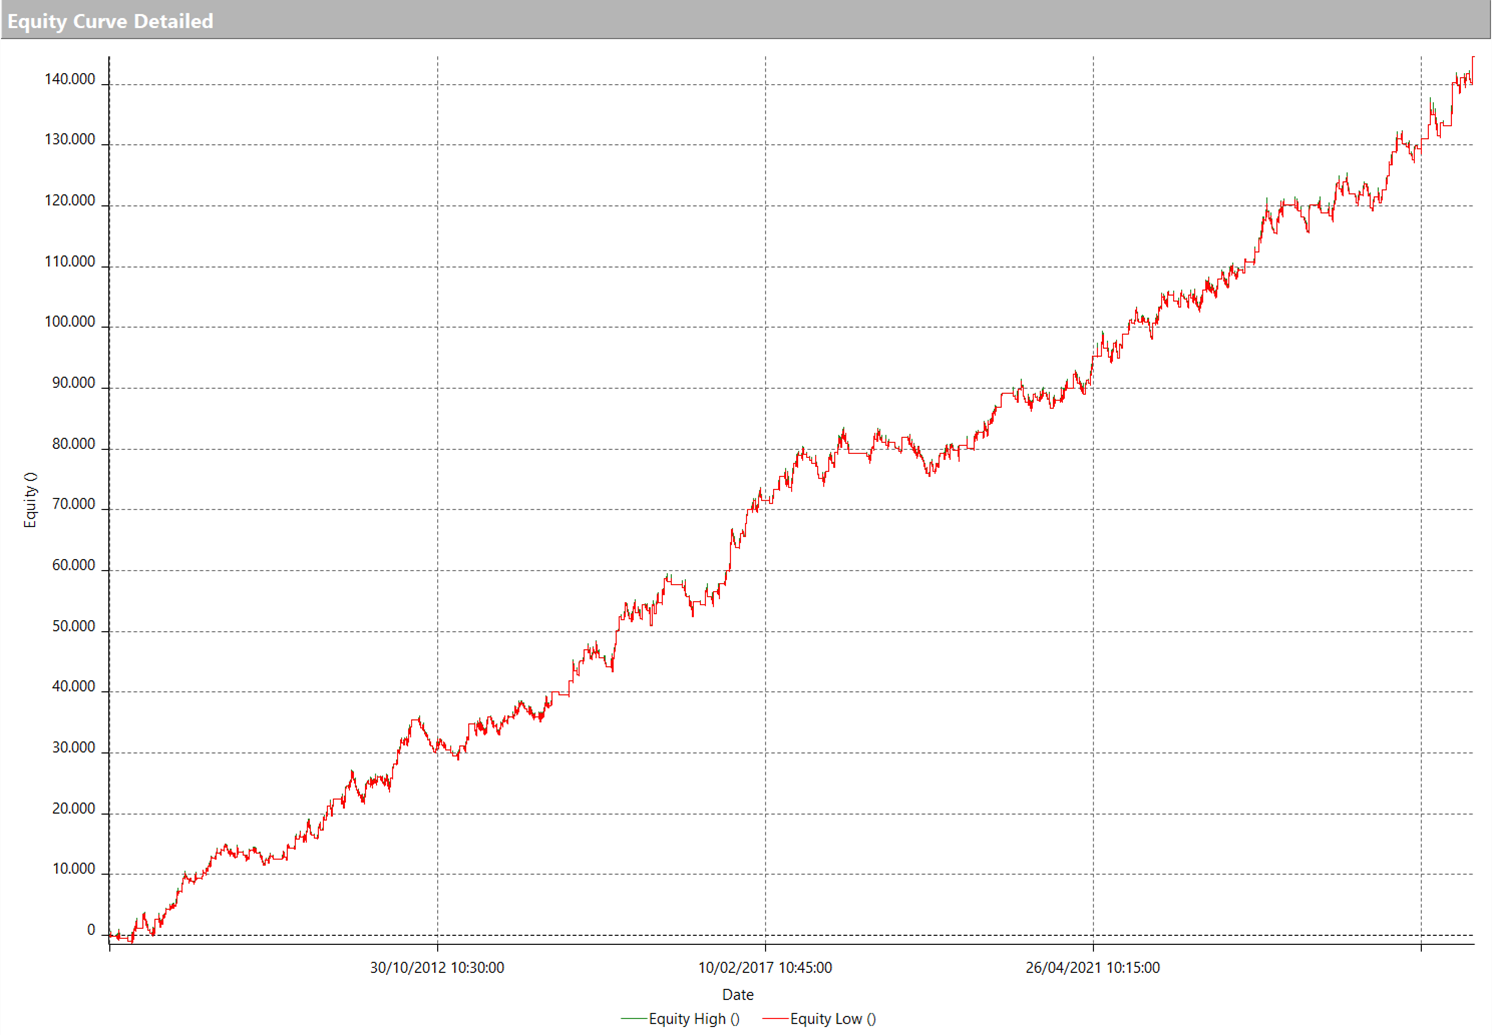
So let’s go and see what the performance is like on Dow Jones. The shape of the equity curve is certainly interesting and, especially from the 2008 crisis onwards, it seems to be performing particularly well.
In this case, I’m choosing the 5 stocks at the center of the ranking of the Dow Jones Industrial Average index, which includes a total of 30 stocks.
Overall, the strategy seems to perform better than the benchmark. However, this is not always true. For example, during the subprime mortgage crisis, the strategy performed much worse than the benchmark. In fact, its drawdown was much higher.
Anyway, we can say that from 2009 onwards, the strategy has been performing significantly better than the benchmark. Moreover, if we look at the drawdown during the worst period of the Covid pandemic, it seems that the strategy’s drawdown is rather similar to that of the benchmark or even better. Note that they are on two different scales, due to the reinvestment of the profits being enabled.
So for sure, there seems to be an edge here, an advantage that is definitely interesting.
The overall performance year after year also looks pretty good. A glance is enough to see that the strategy performed worse than the benchmark in 2008. And there are also some other years in which it seems to have produced worse results.
In general, we can say that before 2008 the benchmark tended to perform better in most of the years, although not in all of them. However, from 2009 onwards, the strategy seems to have performed better than the benchmark.
Let’s now see what happens on Nasdaq. We use the same rules and, obviously, since this index is larger than Dow Jones, we’ll take 10 stocks instead of 5 for our test.
So let’s go and see the results. Okay, the strategy seems to perform much worse than the benchmark. I remind you again that the strategy is the black line that is called Total Portfolio in the legend, while the benchmark is the Nasdaq 100 index. In general, it seems that the strategy has always performed worse than the benchmark.
We can even see that the benchmark recovered from the very bad peak of drawdown of 2009 a lot of time before the strategy did.
In light of these results, I’d honestly forget about applying this strategy to Nasdaq, since the “buy and hold” approach works much better.
If we look at the figures, we see that the drawdown of the two curves is very similar. In one case it’s minus 84% and minus 63%, while in the other it’s minus 83%. Nevertheless, the strategy seems to perform much worse in terms of average annual earnings. In fact, while the strategy makes 8.66% per year, the C.A.G.R., that is, the average compound annual return of the benchmark is 14.48%. So the benchmark is definitely better than the strategy in this case.
If we look at the annual profits, we can immediately see that there are very few years in which the strategy has performed better than the benchmark, so I don’t see any significant advantage in applying this approach to the Nasdaq index.
And that’s all for this video!
Thanks so much, we’ll see you in the next video! Bye Bye!