
Welcome back to our regular performance review of some of the most effective trading strategies in our portfolio.
Today, we’re focusing on two trend-following strategies that operate on one of the most important stock markets in the world: the Nasdaq. This tech-heavy index is not only iconic. It’s arguably the most representative market of the last decade.
Thanks to the strong long-term trend that has been in place for years, the Nasdaq has become highly compatible with trend-following logic, which, as we’ll see, has delivered excellent results.
Trading Strategy #1 – Multiday Trend-Following on Nasdaq Futures (@NQ)
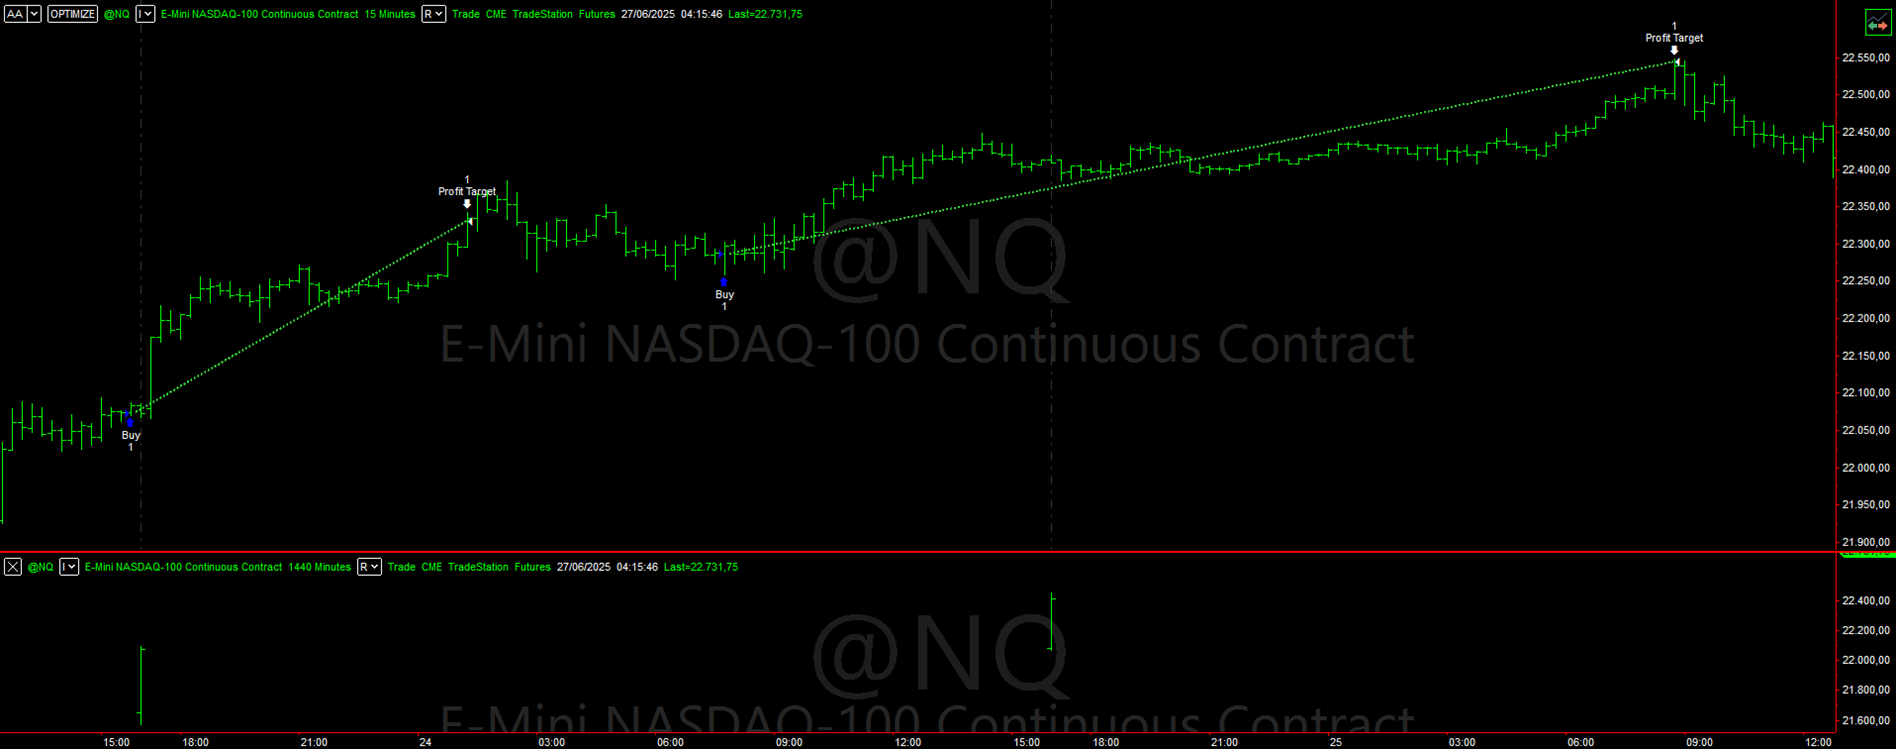
The first trading strategy we’ll examine operates on a dual time frame: 15-minute bars (for Data1) and 1440-minute bars (daily, for Data2). It runs on the standard 23-hour session from 5:00 PM to 4:00 PM (Exchange time).
The strategy enters trades based on breakouts from volatility channels built using a well-known indicator: the Average True Range (ATR). This setup is typically very effective on volatile markets like the Nasdaq.
All trades are filtered through proprietary pattern libraries and additional volatility filters. Open positions are closed either at a predefined monetary stop loss or take profit, or after a specific number of sessions if neither target is hit.
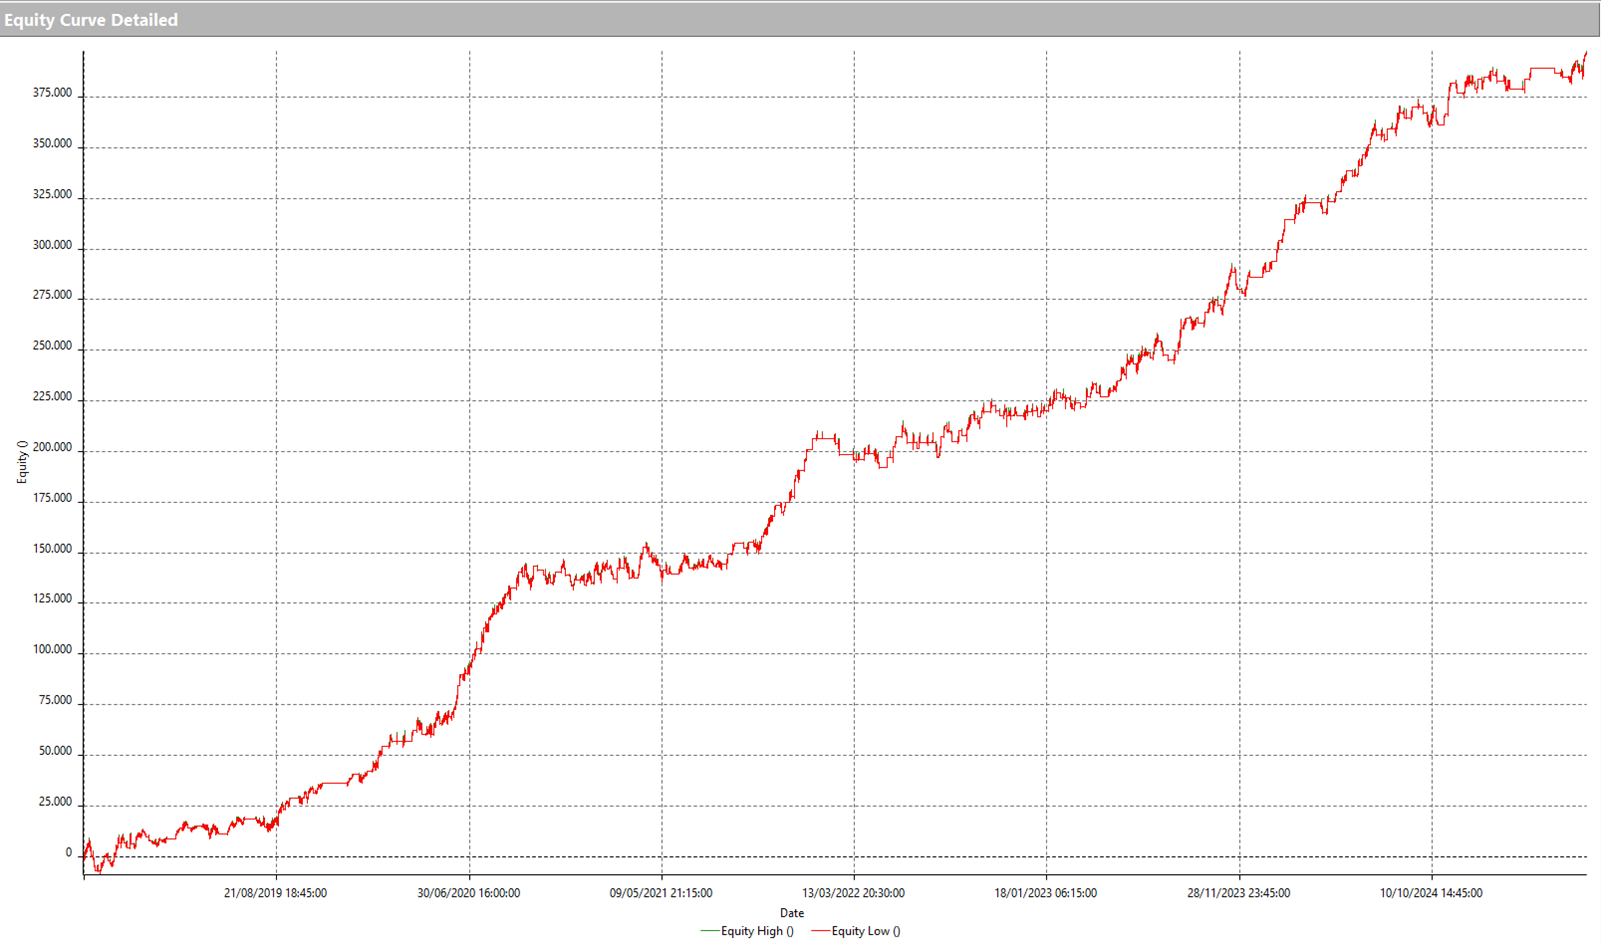
In the chart below, you can observe the equity line starting in 2018, a pivotal year when a surge of institutional and retail liquidity began flowing into the Nasdaq. This influx gave a significant boost to any well-designed trading strategies on the index.
The results have been exceptional, with a smooth and consistent equity curve throughout the entire period.
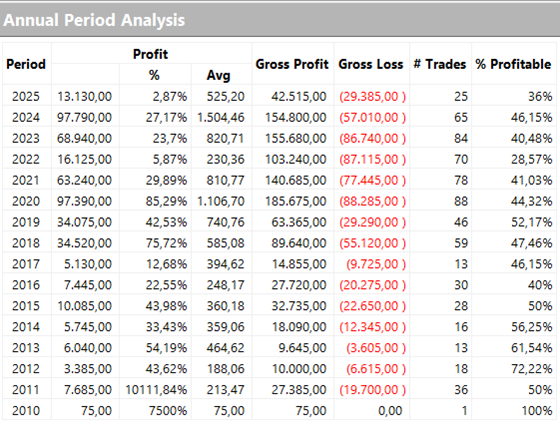
On an annual basis, we see that this system performed significantly better in the post-COVID era. In both 2020 and 2024, for example, the annual net profit reached nearly $100,000 using just one standard contract. Even in a turbulent year like the current one, the system still ended up in the green, with a profit of $13,130.
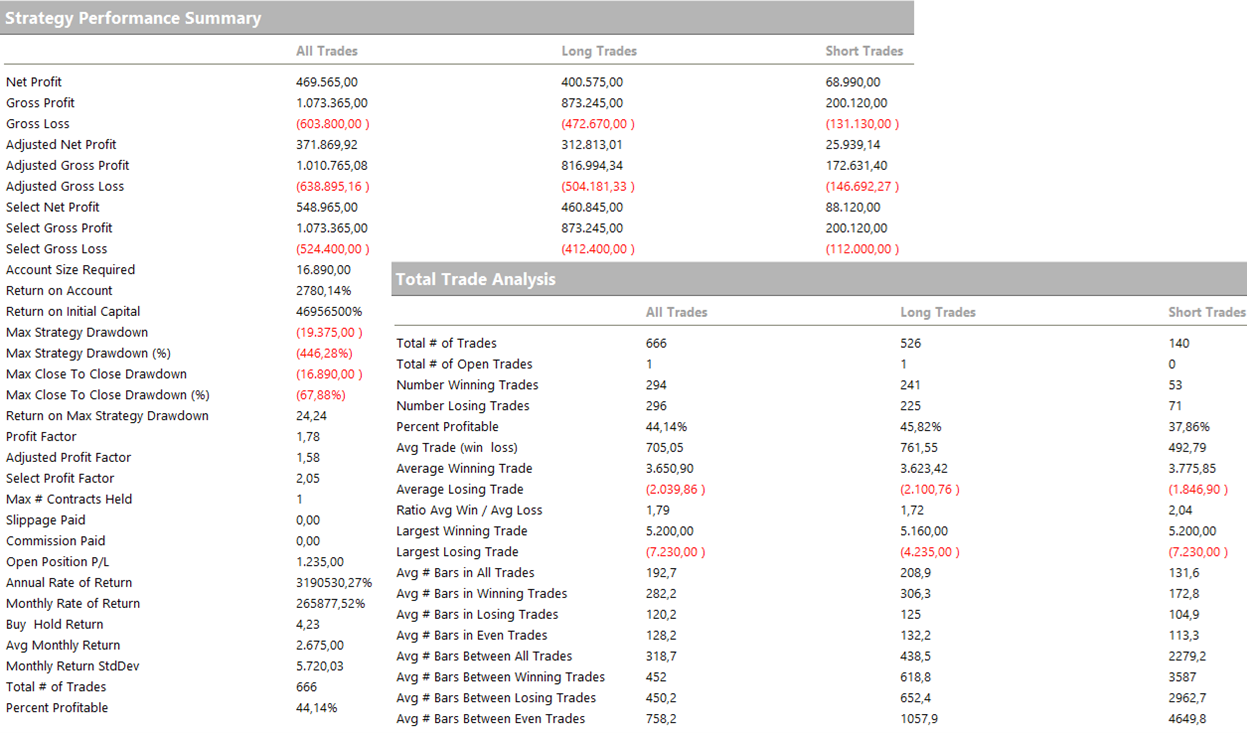
Looking at the overall performance metrics, one thing immediately stands out: besides the outstanding net profit, the drawdown is very modest (under $20,000) for a strategy trading such a volatile instrument. Even more impressive is the average trade size: a solid $700, which is an excellent figure.
It’s also worth noting that the micro version of the Nasdaq futures contract (@MNQ) has been available for several years. It’s highly liquid and especially popular among retail traders worldwide.
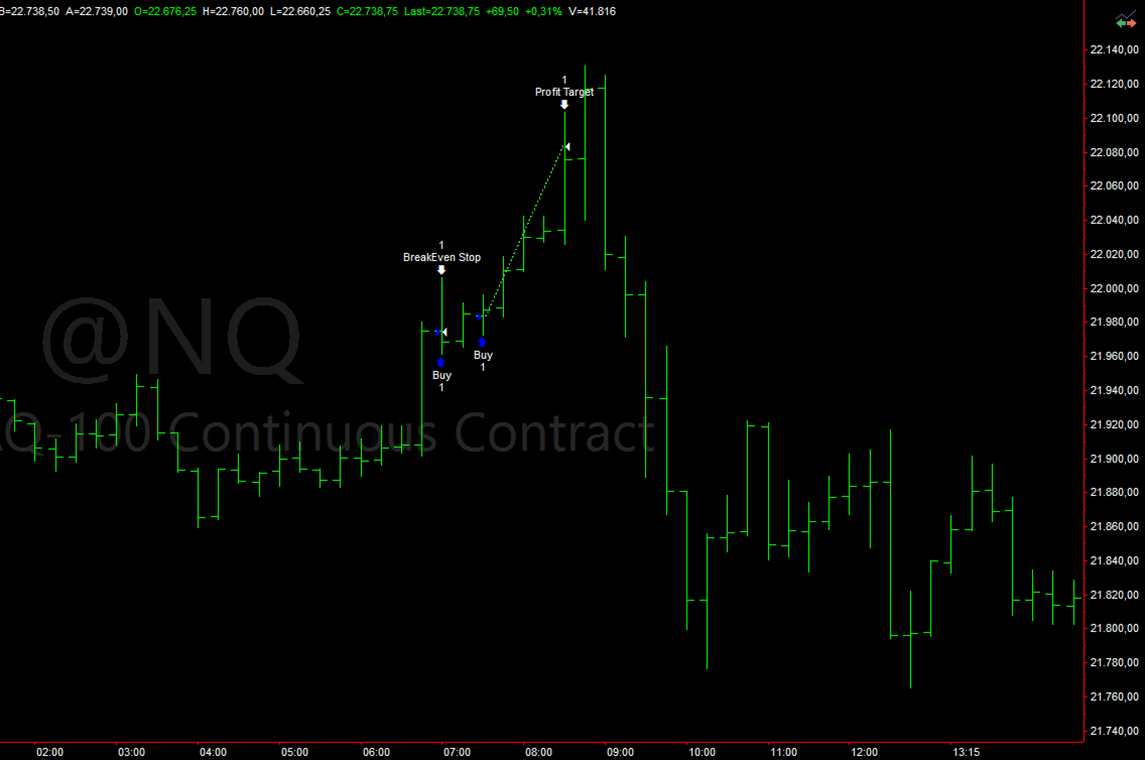
Trading Strategy #2 – Intraday Trend Following on the Nasdaq @NQ
Let’s move on to the second strategy, which is also a Trend Following model operating on a 15-minute time frame. Just like the previous system, this one is based on a classic breakout approach, where entries are triggered by the breakout of a volatility channel. However, this strategy takes things a step further by using a stricter setup designed to isolate only the best conditions for fast price movements.
As an intraday strategy, all open positions are closed by the end of the trading day.
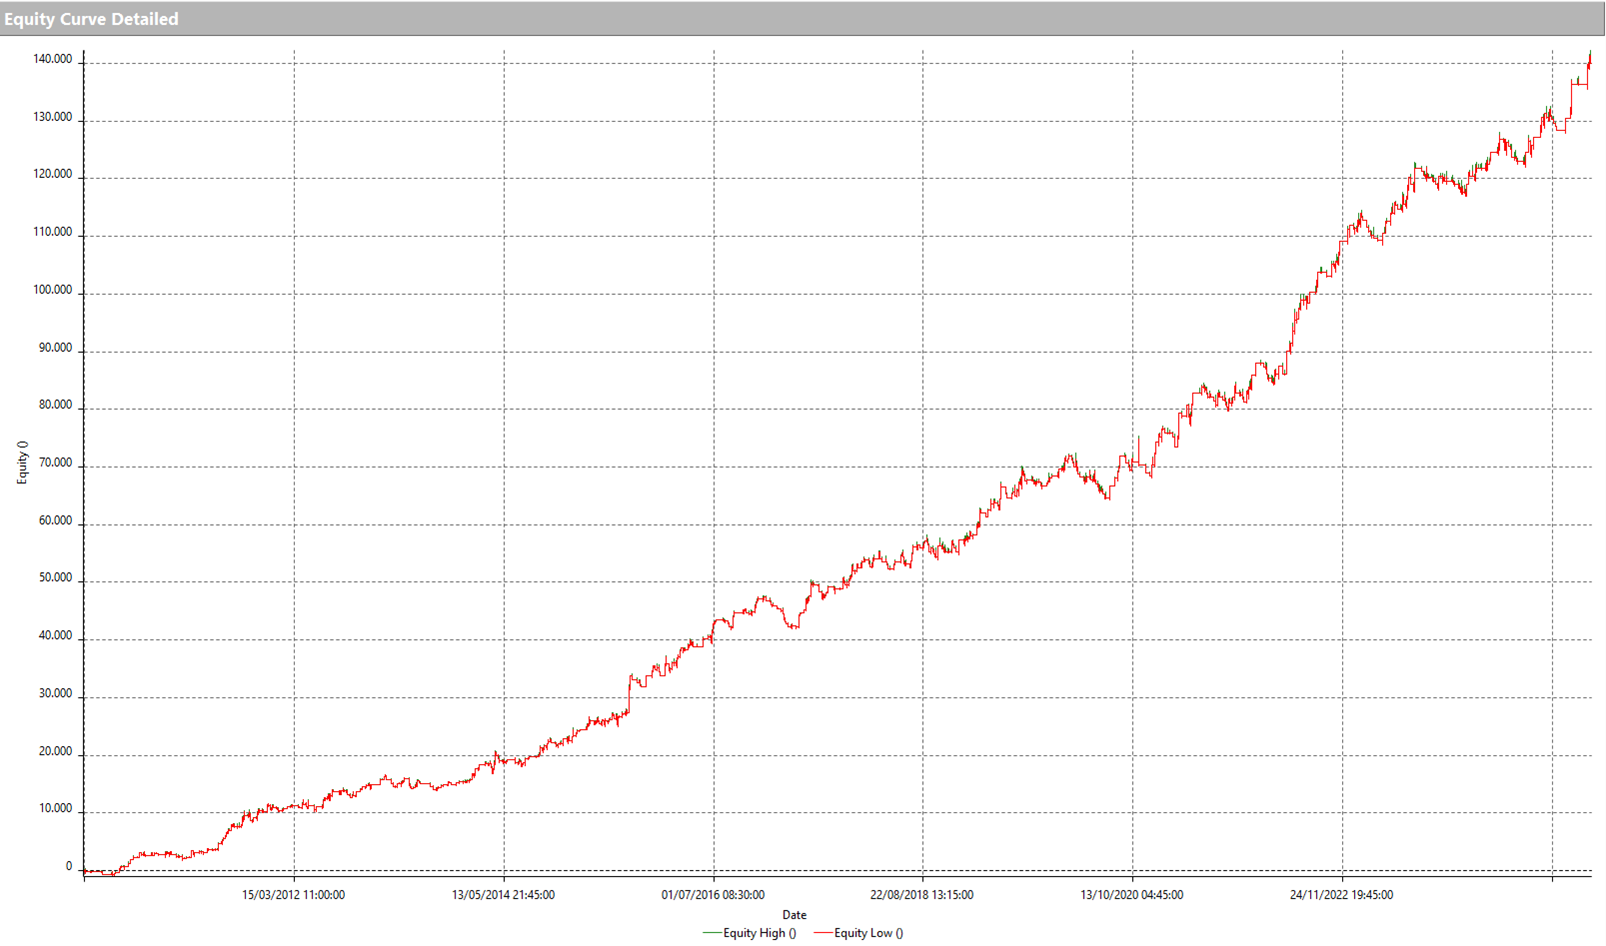
The profit curve from 2010 to the present shows a steady and consistent upward trajectory, much like the previous strategy. It performs with great regularity across the entire historical period under review.
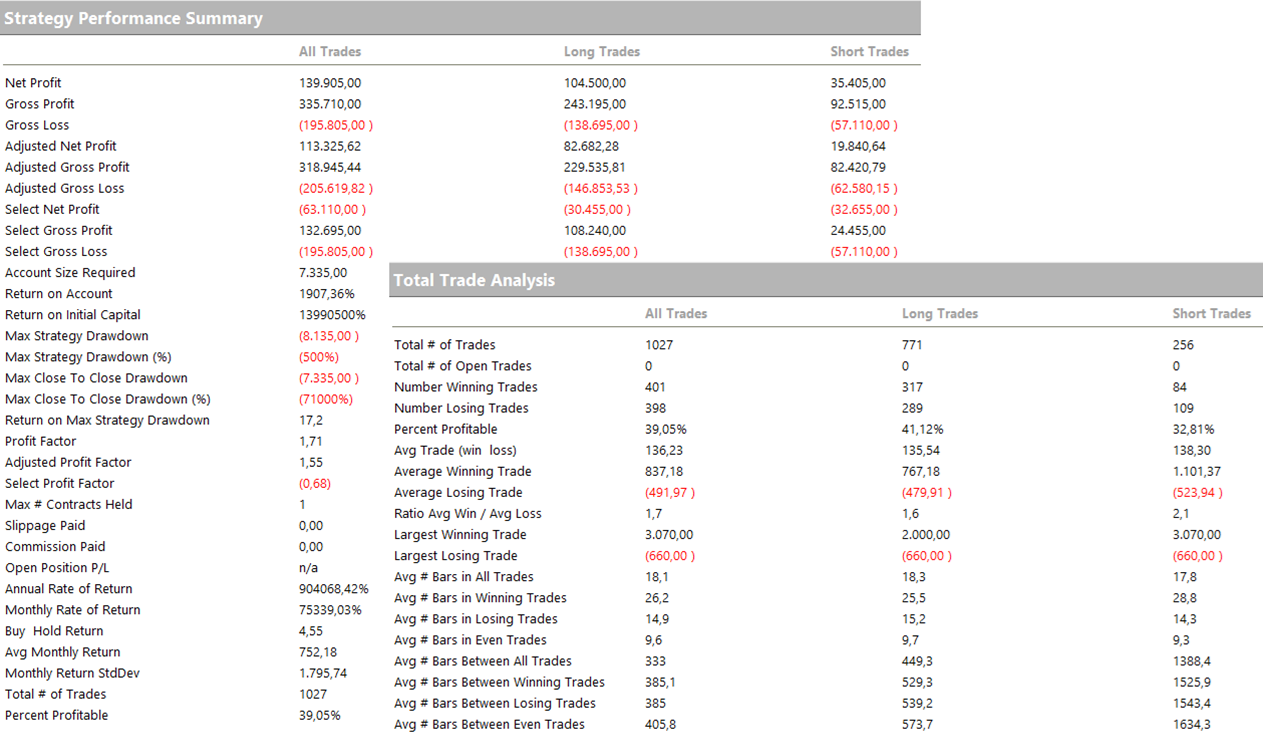
Next, let’s look at the Total Trade Analysis and the Strategy Performance Summary. As expected, this strategy executes more trades than the previous one, with an average trade size of around $140. Despite that, the maximum drawdown remains impressively low, just $8,000, even for an intraday system.
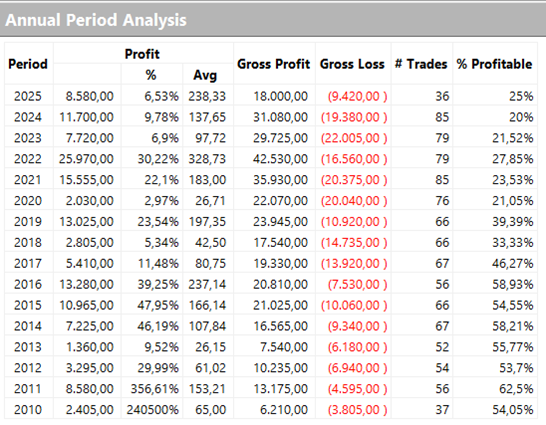
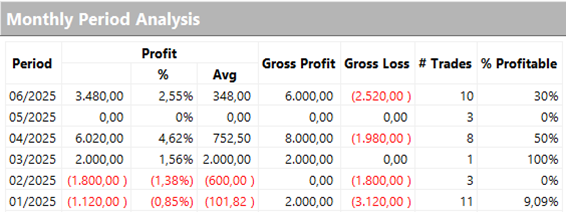
When examining the yearly returns, we can see that this is a highly consistent system. It performed very well in 2025, even during challenging months like March, April, and June, delivering solid profits in those periods.
Conclusions on Trend Following Trading Strategies on the Nasdaq
We’ve come to the end of this article, and as always, we hope it has helped you find new ideas to inspire your own trading systems.
Would you like to learn how to build automated strategies like these and start systematic trading on futures?
Book a free consultation with a Unger Academy® expert today.
In less than an hour, you’ll discover whether our algorithmic trading method is a good fit for you.
Happy trading, and see you next time!


