Definiremo una strategia che ti permetterà di avere tutto quello che ti serve per guadagnare costruendo e operando il tuo portafoglio di strategie automatizzate... Rispondi a qualche domanda nel nostro questionario e poi scegli giorno e ora più adatti a te.
PRENOTA ORA LA TUA CONSULENZA STRATEGICA >>A volte le idee più semplici sono anche le più efficaci…
Non servono indicatori super complessi o decine di condizioni per sfruttare i movimenti dei mercati. Bastano un'idea semplice e un po' di buon senso!
In questo video ti mostriamo come creare una strategia per il future sull'S&P 500 in grado di produrre un'ottima equity line nonostante la sua semplicità.
Guardando il video scoprirai:
- Su quali regole è basata la strategia
- Come codificarla partendo completamente da zero in EasyLanguage o PowerLanguage (con sistema a codice aperto)
- Che performance potresti ottenere con questa strategia
Inoltre, dal momento che si tratta della registrazione di una diretta YouTube, oltre a seguire la creazione del sistema potrai anche ascoltare le risposte alle domande poste dagli spettatori nel corso della diretta.
Da non perdere! Buona visione 😎
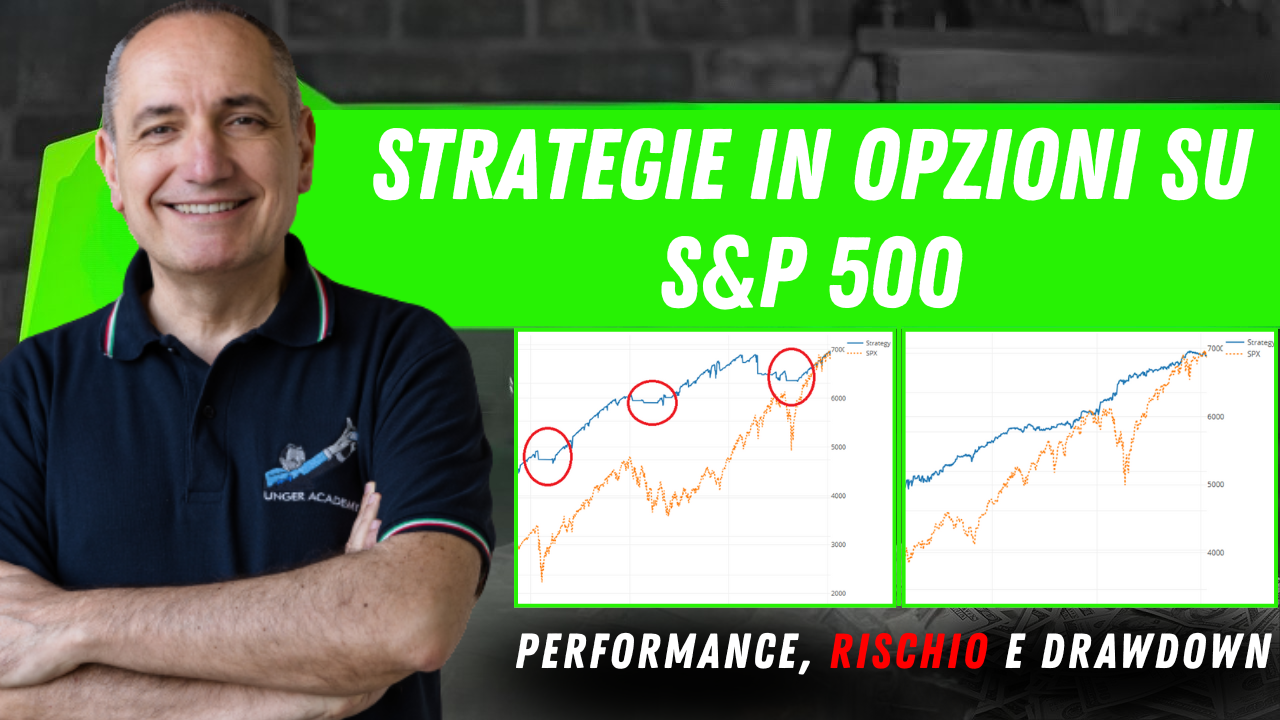
Hey everyone and welcome back! One of the coaches at Unger Academy here and this equity line you see in this moment is the result of a trading system on the Mini S&P 500 future which we developed starting from a very simple starter script. We also applied some even banal exit rules and as you can see, we have excellent results both in terms of stability and profitability.
Now in this video we’re going to be talking about how effective it is to trade with simple ideas. It isn't necessary to experiment with complex indicators or indicators of indicators and so on. What we really need to do is to understand the nature of a market and to figure out how to make the most of its special features in a simple way.
But let's start from scratch and begin creating our trading system. Let's start from the basics, the "core" of the system.
As you can see, we’re starting from an empty code, as always. So the first condition we're going to write is the following one: if there's a cross between the close of the bar and the low of the previous session, then we'll buy the next bar at market.
Vice versa, if the close crosses below the high of the previous session, then we're going to sell the next bar at market. So let's try to compile this code and see what we get.
The equity line we get is already quite interesting, especially if we consider that we obtained it with just two lines of code. It goes up and has a fairly good average trade of $105.
The number of trades is 1655, which is pretty high. So what's the problem with this strategy? The problem is that it trades 100% of the time. Indeed, we never give this system a chance to exit, except when we give an order to reverse the trade. So, we'll either be long or we'll be short. If you look at the chart, you can see that there are no conditions where we are flat.
As always, of course, what could we set as our first exit? We could set a profit target and a stop loss, maybe $3,000 and $1,000, respectively, which are pretty reasonable values for the Mini S&P 500 future.
So let's compile the strategy and see what the effects are and how the trades made by the strategy change.
Now, I'd like to focus specifically on this case, where we have three long entries that are all based on the same condition. You can see that we have a price drop. Then if a candlestick is formed, and it returns to levels above the low of the previous session, namely this level, after this bar the strategy enters long at the next bar.
The same thing happened here. As you can see, the close is near the low of the previous session. The next close is above it. We go long and again we hit the stop.
An idea that could come from looking at this type of setup would be to limit the number of trades per session to one. To do this, we can simply use a condition based on the market position.
Indeed, if we find ourselves at the last session bar, then we'll say that "condition1", which will be our condition to enable entries, is equal to "true".
Otherwise, if the market position changes and becomes different than zero, which means that we are either long or short, then "condition1" will be equal to "false".
So let's add this condition before the trading orders. So let's write: "if condition1 then begin". These are our two conditions inside the IF construct, which will only be executed if condition1 is true. At the end of this group of conditions we'll put the keyword "END".
And in that way, if we go and compile the system, we’ll obtain.... Here we have, as you've seen, only one entry per session. So only one entry here, only one entry here, and so on.
Another thing that I want to point out is another little catch that could happen, namely that of entering right at the beginning of the session.
You can see that here apparently there is no cross but we still enter at the second bar of the session. This is because to have a cross we need two bars and therefore we must somehow give the possibility to trade, to enter the market, only if we're at least two bars away from the end of the previous session.
It's a good idea to use time conditions that straddle the session by about a couple of hours. A little bit like saying "let the market start, let's leave it a couple of hours to take its direction", and then we'll start trading.
We'll do the same by stopping 2 hours before the end of the session. But how can we tell MultiCharts to trade only when straddling a certain trading time window?
With regard to this market, which opens trading at 5:00 p.m. (so the first bar closes at 5:30 p.m.) and then closes at 4:00 p.m., we could simply say "IF time is greater or equal to 1900)", namely 5 pm plus 2 hours, "OR t is less than 1400", in other words if we are between 7 pm of this day and 2 pm of the next day, then we'll trade.
Let's go compile our script and see what we get. We'll see that these nasty entries no longer appear at the beginning of the session. And what do we get? In the end we'll get this equity line, which is exactly the same that we started with.
It's a very good equity line and we also have a large average trade that lets us cover all the operating costs related to this system, so both slippage and commission costs.
So as you can see, the ideas behind it are very simple. Finally we could add another condition and set a temporal exit. Why am I suggesting this kind of exit?
Well because if the market doesn't make any decision and we don't reach either the stop loss or the profit target, then it might be convenient to add an additional condition, where we say that if the bar count since we entered the market is greater than 230...
Because remember that a session is 23 hours long and therefore 23 hours multiplied by 30-minute bars is equal to 46 bars per session. And 46 times 5 is equal to 230.
So here we're simply saying that if 5 sessions have passed (which corresponds to a trading week) since we entered the market, then exit the position because the cross based on the high or the low of 5 days ago may no longer be valid.
So, we'd better exit the trades. So let's go and add this condition as well. You'll see that we have a slight change in the average trade but really nothing else. We're obviously making more trades now but we have enhanced the equity line.
You see that this part has been declining since the beginning of the year, so since late 2021 - early 2022. Given the current situation, the strategy isn't performing well, but the same goes for the index as well.
Consider that in this period the future is significantly larger than it was in 2008, so here we could also introduce some position sizing rules to be able to compare the strategy in this period with this other period.
Right now I've nothing else to add. I believe that this started script can be a good starting point from which you can go ahead in the development of this system, perhaps by adding a filter based on volatility or directionality. In short, you can have some fun.
What I do want to tell you, however, is to operate in a simple way, using simple ideas that, I guarantee, always turn out to be the most solid and performing in the long run.
Okay so if there is someone among you who is interested in the world of systematic trading, we're going to leave a link in the description of this video from which you can access a video of Andrea Unger, or get our best-selling book covering only the shipping costs, or even book a free call with a member of our team.
If you liked the video, please leave us a Like. Subscribe to our channel and click on the notification bell so that you can stay updated on the release of all our new videos.
And with that, we will see you in our next video. Bye-bye everyone!
Definiremo una strategia che ti permetterà di avere tutto quello che ti serve per guadagnare costruendo e operando il tuo portafoglio di strategie automatizzate... Rispondi a qualche domanda nel nostro questionario e poi scegli giorno e ora più adatti a te.
PRENOTA ORA LA TUA CONSULENZA STRATEGICA >>Ciao, sono Andrea Unger, Trader professionista dal 2001 e unico a vincere per ben 4 volte il Campionato del Mondo di Trading con denaro reale.
Grazie a questi risultati sono spesso invitato come relatore in convegni in Europa, Stati Uniti e Asia.
Sono inoltre autore di diversi libri, tra cui il primo in Italiano sulla Gestione del Rischio nel Trading, tradotto anche in Cinese e Inglese.
Metto a disposizione decenni di esperienza, di prove, di vittorie e sconfitte con le quali ho ideato un metodo scientifico, sistematico, replicabile e universale con cui, in soli 4 anni, più di 1.000 trader sono riusciti a rendersi autonomi.
Devi sapere infatti che gli studi dimostrano che solo il 25% dei trader guadagna, ma di questi ben il 90% lo fa con il trading sistematico...
Come mai allora i formatori insegnano quasi sempre solo il trading discrezionale?
Non ti insegno a diventare ricco in poco tempo, ti insegno una professione che, con il duro lavoro, la passione, e sufficienti capitali potrebbe diventare la tua principale fonte di reddito.